A visual MQTT client is often the fastest way to make sense of a busy IoT broker. MQTT Explorer gives you a topic tree, live payloads, retained-state visibility, and quick publish controls, which makes it useful when sensors, gateways, and automation systems start talking over each other. I focus here on what it actually helps with, how to use it well, and where it stops being the right tool.
The quickest way to see what a broker is really doing
- A tree view mirrors MQTT topic hierarchy, so nested device data is easier to scan than raw logs.
- It is strongest for checking retained state, message shape, and topic naming before code changes go live.
- The most useful features for debugging are search and filter, diff history, plotting, and controlled publishing.
- It is a desktop-first inspector, not a replacement for broker logs, metrics, or packet-level troubleshooting.
- For UK IoT teams, it fits well alongside smart-building, energy, and edge-gateway workflows.
What it is and where it helps
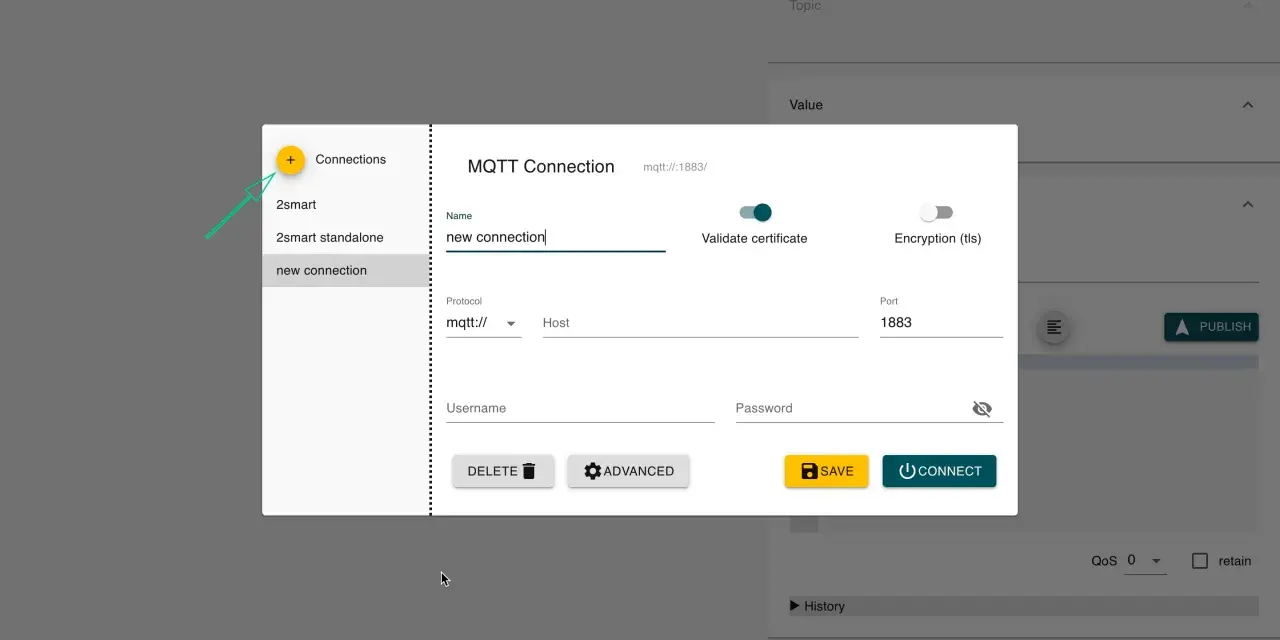
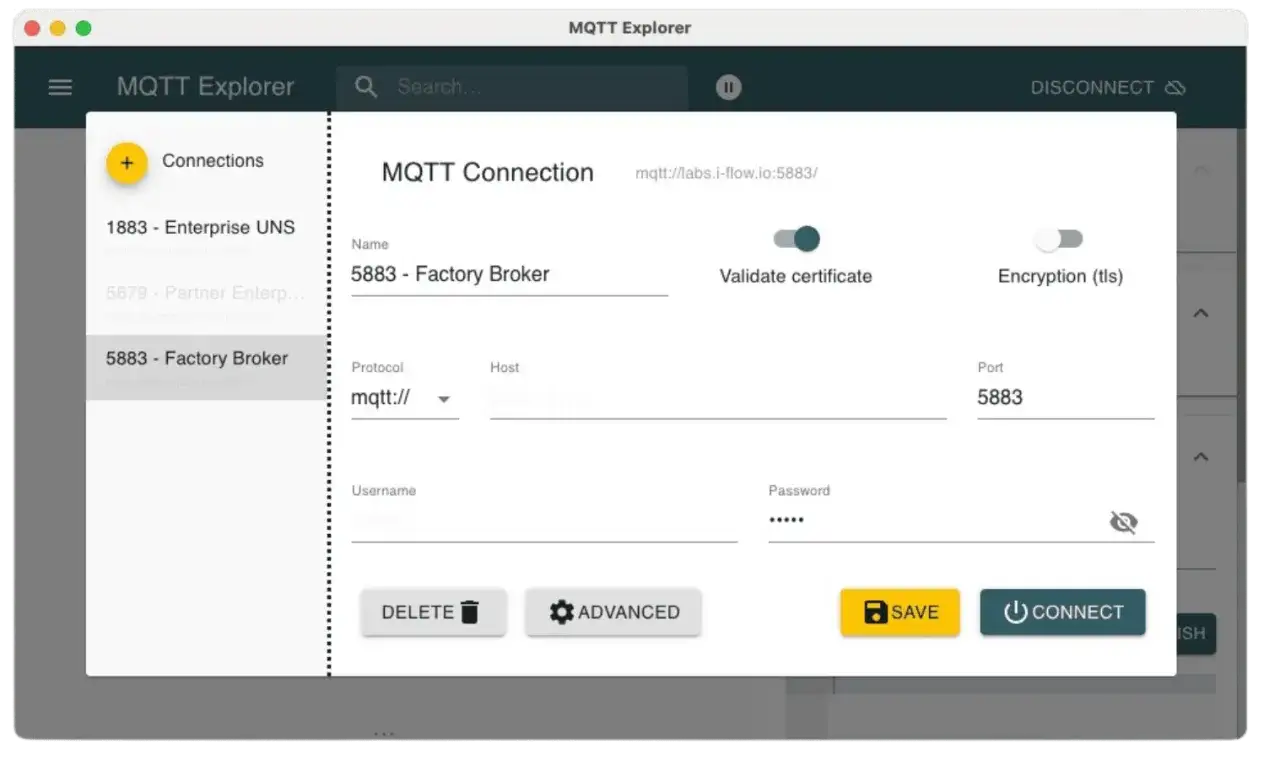
I treat this kind of client as a broker microscope. It connects to an MQTT broker, shows topics as a tree, lets me inspect payloads as they change, publish test messages, and clean up retained topics that no longer belong.
That matters because IoT systems fail in boring ways: a sensor starts publishing under a slightly different topic, a retained message keeps showing an old value after a device reboot, or a wildcard subscription hides too much noise. A visual client makes those problems visible in seconds instead of forcing me to grep through logs or write a one-off script.
It is not a broker and not an observability platform. I would not use it to replace metrics, ACL audits, or long-term retention analysis. I use it when I need an answer fast. Once you accept that role, the features become easier to judge.
The features that matter when the broker gets busy
The features that matter are not the flashy ones. They are the ones that help you tell good data from bad data without widening the blast radius.
| Feature | Why it matters | What I watch for |
|---|---|---|
| Topic tree | Mirrors MQTT hierarchy | Best for deeply nested telemetry such as building, device, room, and signal paths |
| Search and filter | Reduces noise | Useful when one broker carries many devices, services, and retained states |
| Diff view and history | Shows change over time | Helps spot payload regressions, missing fields, and stale values |
| Plot numeric topics | Quick sanity checks | Especially useful for temperature, humidity, energy, pressure, and similar sensor streams |
| Retained-topic controls | Removes stale state | Important when a device reboot leaves an old value behind |
| Publish panel | Tests the broker without firmware changes | Good for sending a known payload or checking a command path end to end |
The current package set covers desktop installs on Windows, macOS, and Linux, and there is also browser and Docker mode for environments where a local install is awkward. In managed workplaces, that flexibility matters almost as much as the UI itself. Knowing which buttons matter is useful, but the real win comes from using them in the right order.
How to use it against a broker step by step
When I debug a broker, I start narrow. The goal is to prove one path, not to flood the screen.
- Connect with the broker address, port, credentials, and TLS settings first. If the broker uses certificates or client authentication, validate that before touching subscriptions.
- Subscribe to one known device, room, or service path. A wildcard such as
#is tempting, but it can swamp the UI on a busy broker. - Check whether the topic already carries retained data. If a value appears instantly on connect, you may be looking at broker-stored state rather than a fresh sensor reading.
- Inspect payload shape and change pattern. For JSON payloads, watch for missing fields, renamed keys, or type changes from number to string.
- Publish a controlled test message. Use a value that makes it obvious whether the path works, such as a sentinel number or a simple status flag.
- Clean up carefully. If you are testing retained topics, delete only the topic you created unless you are certain the whole subtree is safe to remove.
While you are doing that, keep QoS in mind. QoS 0 is best effort, QoS 1 can be delivered more than once, and QoS 2 is the most controlled but also the heaviest. I usually leave QoS alone during visual debugging unless I am specifically checking delivery guarantees. That workflow is useful everywhere, but it becomes especially practical when you look at the kind of IoT deployments many UK teams run.
Where it fits in a UK IoT workflow
In the UK, I see this tool fitting best in smart buildings, energy monitoring, EV charging, and industrial telemetry. Those setups often mix cloud services, edge gateways, and local brokers, so the first task is simply to understand what is flowing where.
| Tool | Best use | What it answers |
|---|---|---|
| Visual MQTT client | Inspect live topics and payloads | Which device is publishing stale or malformed data? |
| CLI tools | Repeatable checks and automation | Can I prove that a message is arriving from a script or SSH session? |
| Broker dashboard | Capacity and health monitoring | How loaded is the broker, and are connections stable? |
| Packet capture | TLS and network troubleshooting | Is the connection failing before MQTT logic even starts? |
I would not force one tool to do all four jobs. The visual client is strongest in the middle of that stack, where you already know the broker is reachable and need to understand the message content. That middle layer is valuable, but it has clear limits.
Where it saves time and where it does not
The app is currently presented as a beta release, so I would test the exact build on the same operating system and architecture your team uses before you depend on it. It is also advertised as handling thousands of topics and very high message rates, which is enough for many real-world brokers. Still, I would not point a broad wildcard at a production broker just because the UI allows it; topic filters can explode into too much noise, and a large tree can hide the exact field you care about.
- It saves time when you need to verify one device, one room, or one service path.
- It does not replace broker logs when you are chasing auth failures, ACL mistakes, or reconnect storms.
- It does not replace long-term metrics when you need throughput, latency, or uptime trends.
- It becomes less useful when your topic taxonomy is chaotic, because the tree mirrors the mess in the data.
- It can be awkward on some ARM deployments, so I would verify the package before standardising it.
Those constraints are not deal-breakers, but they do shape how I would roll it out. The last question is not whether it looks useful, but whether it fits your operating model.
The checks I would run before putting it in a team workflow
Before I let a team rely on this kind of client, I want three things in place: a clean topic naming convention, a small broker sandbox for tests, and a lightweight CLI fallback for automation. That combination keeps the visual tool useful instead of turning it into the only way anyone understands the broker.
- Document topic patterns and reserved namespaces.
- Separate retained state from ephemeral telemetry.
- Keep a few known-good test payloads for smoke checks.
- Pair the client with broker logs and a CLI subscriber.
- Delete retained messages only when you know who owns the topic.
Used that way, it becomes a practical broker lens rather than a toy GUI. For IoT teams, that is usually the difference between guessing at message flow and fixing the real problem in one pass.