The fastest way to read an NMS is as a chain from device data to operator action
- The most useful model is simple: discover devices, collect signals, correlate events, and expose clear actions.
- SNMP is still common, but streaming telemetry is better for high-frequency visibility and scale.
- Alerts only become useful when they are deduplicated, prioritised and tied to an owner or workflow.
- Configuration backup, change tracking and access control are core operational controls, not optional extras.
- For UK organisations, cloud, on-premises and hybrid deployments can all work; the right choice depends on control, latency and data handling.
The core pieces of an NMS and what each one actually does
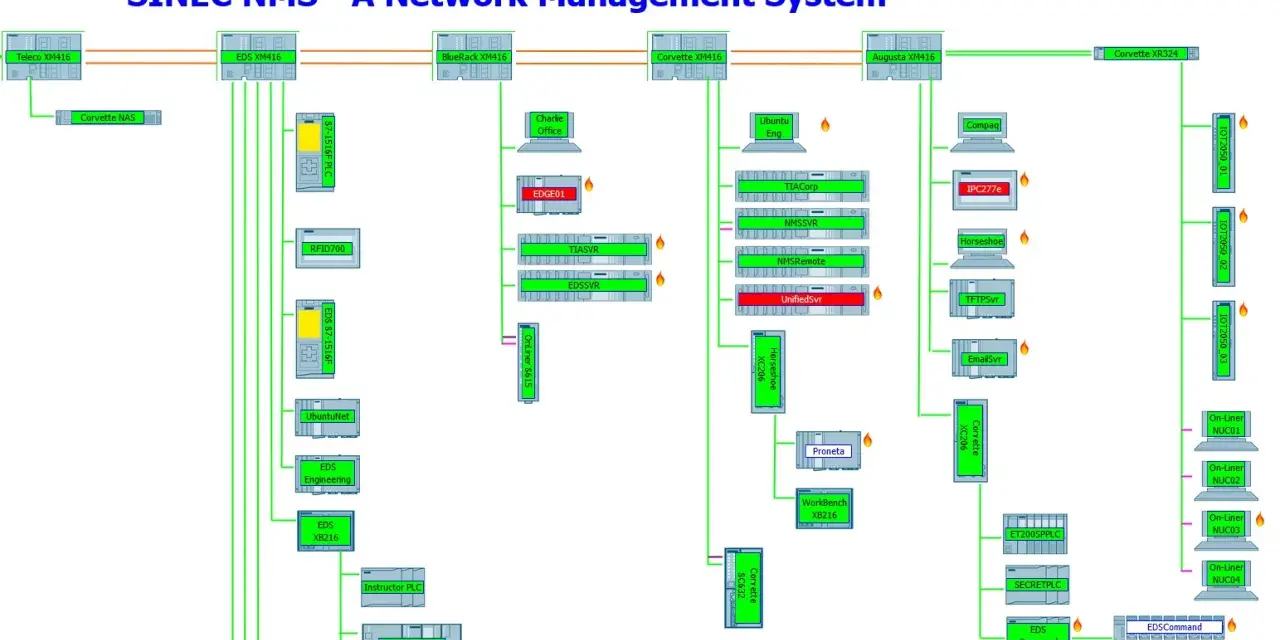
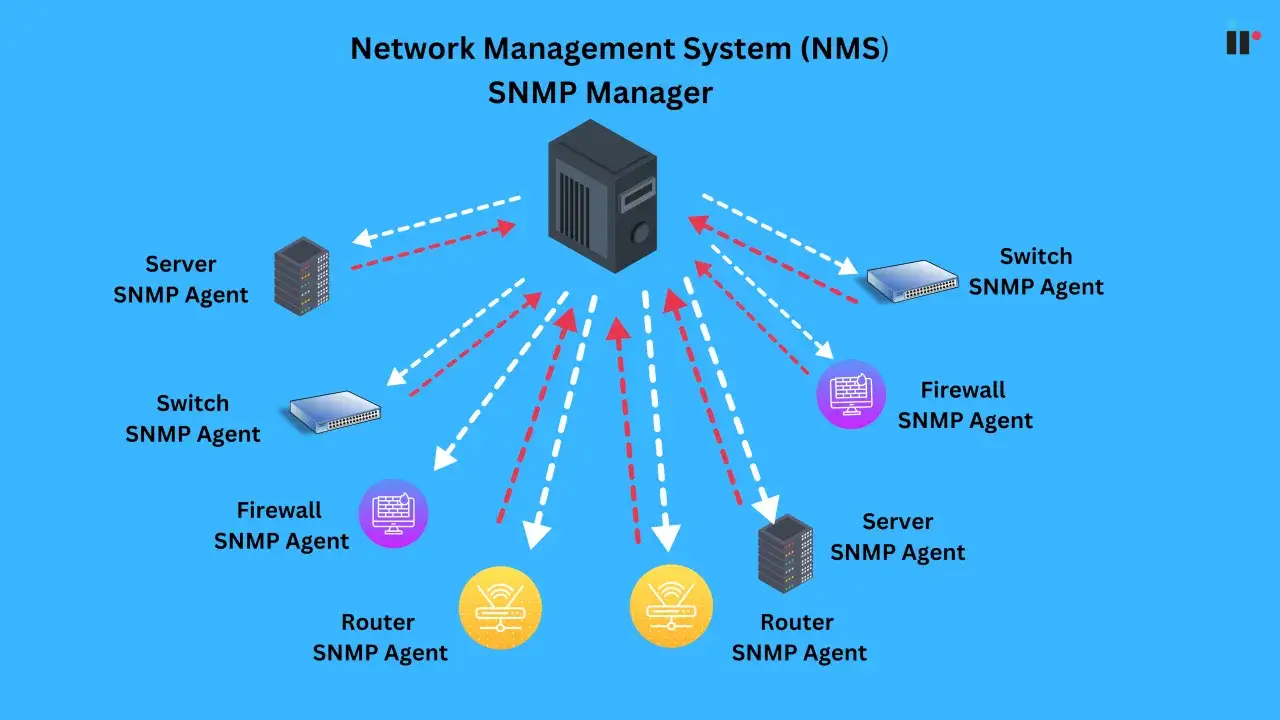
I usually break the stack down with the old FCAPS lens because it keeps the conversation honest: fault, configuration, accounting, performance and security. That model is still useful in 2026, but in practice the platform is made up of more concrete parts that sit above and below those functions. On the device side, an agent is the small software process that exposes local status, while a MIB is the device’s management dictionary, the structured set of values the manager can query.
| Part | What it does | Why it matters |
|---|---|---|
| Managed devices | Routers, switches, firewalls, access points, servers and other nodes that expose status and counters. | They are the source of truth. If they are not discovered, the rest of the system is guessing. |
| Agents and collectors | Pull or receive data using protocols and local software hooks. | They move raw device state into the management platform in a usable form. |
| Discovery and topology engine | Finds devices, links and dependencies, then builds a live map. | Without topology, a fault is just an alert. With topology, it becomes a traceable incident. |
| Database and inventory store | Keeps metrics, device metadata, configuration snapshots and historical records. | This is what makes trending, audit work and forensic analysis possible. |
| Correlation and rules engine | Groups related events, removes duplicates and applies thresholds or business rules. | It prevents alert storms and helps the team focus on root causes. |
| Dashboards and reports | Shows live health, trends, SLA views and operational summaries. | Different teams need different views, from the NOC to management. |
| Automation and configuration module | Handles backups, restores, drift detection and approved changes. | This is where the platform stops being passive and starts reducing manual effort. |
| Security and access control layer | Manages roles, authentication, authorisation and audit trails. | It keeps the management plane trustworthy, which is non-negotiable in any serious environment. |
The main thing to notice is that the system is not just a pile of tools. It is a chain of dependencies, and each link has to work for the next one to make sense. Once that structure is clear, the next question is how the platform actually gets its data.
How devices feed the system with useful data
Collection is where most bad assumptions show up. Some teams want a single protocol to do everything; in reality, different data sources solve different problems. Cisco notes that SNMP is still widely supported, while streaming telemetry is increasingly preferred when you need scale, frequency and richer data points. I agree with that split: SNMP is still useful, but it is rarely the best answer for everything.
| Collection method | Best for | Strengths | Trade-offs |
|---|---|---|---|
| SNMP polling | Basic status, counters and device reachability | Widely supported, simple to understand, works across many vendors | Polling can be slow at scale and may miss fast changes between intervals |
| Streaming telemetry | High-frequency performance data and near real-time monitoring | Scales better, delivers richer data, supports more proactive operations | Needs more modern device support and a stronger data pipeline |
| Syslog and traps | Events, warnings and fault notifications | Good for immediate incident signals and device-generated messages | Can be noisy and inconsistent if message quality is poor |
| Flow records | Traffic analysis and capacity planning | Shows who is talking to whom, and how much bandwidth is moving | Does not replace health monitoring; it complements it |
| ICMP and active checks | Reachability, latency and loss checks | Easy to deploy and good for basic service validation | Useful signal, but far too thin on its own |
The practical lesson is straightforward: use the cheapest signal that is good enough, then add richer telemetry where the business risk justifies it. In a UK branch-heavy estate, I would rather have clean, consistent telemetry from the important devices than a flood of shallow polling from everything. Once the data is flowing, the harder work begins.
Turning raw signals into decisions
Raw data is not insight. A good platform needs a processing layer that can normalise the inputs, understand context and decide what deserves attention. Without that layer, you do not have an operations tool; you have a noisy event collector.
- Normalisation converts different vendor formats into one internal model, so a link-down event means the same thing everywhere.
- Correlation groups symptoms that belong to the same incident, such as a switch failure that drops multiple downstream ports.
- Baselining compares current behaviour with normal behaviour, which is how you spot gradual degradation before users complain.
- Thresholding draws a line between healthy variation and actual risk, but thresholds work best when they are tuned to the service, not copied from a template.
- Dependency mapping shows which devices support which services, so the team can see impact instead of just packet loss.
- Historical analysis keeps enough history to answer the question everyone eventually asks: was this a one-off or a pattern?
This is also where topology matters. A single interface alarm is useful, but it is much more useful when the platform knows that the interface sits on an edge switch feeding a finance office or a customer portal. I think this is one of the most underrated parts of the whole stack because it changes the conversation from “something is broken” to “this service is at risk”. That, in turn, is what makes dashboards and alerting worth building properly.
What operators actually need to see and act on
The presentation layer is where all the upstream engineering gets judged. If the dashboard is cluttered, the alerts are vague, or the report answers the wrong question, nobody trusts the system for long. Good operators need three things: a live view, a prioritised queue and a way to move from detection to action without jumping across five tools.
In a well-run setup, the NOC sees service health and open incidents, engineers see topology and event history, and managers see trend reports and SLA risk. Those views should not be identical. They should be role-specific and honest about what each person needs to do next.
- Live dashboards should answer “what is broken now?”
- Trend reports should answer “what is getting worse?”
- Escalation rules should answer “who owns this next?”
- Ticketing integration should answer “how does this become work?”
- Service views should answer “which business function is exposed?”
An alert without ownership is just noise. A report without context is just decoration. The best systems close that gap by linking the event to the service, the service to the owner and the owner to the workflow. That is the point where the platform starts improving operations rather than merely documenting them.
Why configuration, automation and security belong in the same conversation
This is the layer that many teams postpone until they have already paid for the mistake. Configuration backup, change comparison, software inventory and rollback support are not side features. They are what keep the network stable when a change goes wrong or a device gets replaced under pressure.
Automation matters because manual change is slow, inconsistent and hard to audit. In a serious environment, I want the platform to be able to push approved changes, restore a known-good configuration, and show me exactly what changed, when and by whom. That is not only about efficiency; it is about reducing avoidable risk.
Security deserves the same level of attention. Role-based access control, multi-factor authentication, audit logs and API scoping all belong in the management plane. NIST’s secure operations guidance treats visibility, monitoring and provisioning as part of the defensive surface, which matches how I think about this layer. If someone can change the network, the system must know who they are, what they touched and how to reverse it.
For a UK organisation, this is also where data handling questions become practical. Some teams are comfortable with cloud-first management; others need stronger control over where telemetry, logs and configurations are stored. Neither approach is automatically better. What matters is that the control plane is aligned with your risk profile, not just your procurement preference.
What I would choose for a UK network estate
There is no single deployment model that wins everywhere. The right answer depends on geography, compliance, operational skill and how much of the estate is still on-premises. In the UK, that usually means deciding between cloud-managed, on-premises or hybrid management, and then being realistic about the trade-offs.| Scenario | Best fit | Why |
|---|---|---|
| Small office or branch-led business | Cloud-managed or hybrid | Lower overhead, easier rollout and simpler remote access for distributed teams |
| Large campus or data-centre-heavy estate | On-premises or hybrid | More control, stronger integration and better fit for high-scale local operations |
| Regulated or sovereignty-sensitive organisation | On-premises or tightly controlled hybrid | Better control over retention, access and operational boundaries |
| Multi-site organisation with heavy remote work | Cloud-first with local collectors where needed | Good reach across sites without forcing everything through one central box |
| MSP or multi-tenant environment | Centralised platform with strict tenant separation | Clear separation of duties and easier scale across customers or business units |
The mistake I see most often is choosing a platform for device count rather than for operating model. If your team spends its time handling branches, remote workers and cloud links, then ease of deployment and remote visibility will matter more than raw console depth. If your estate is stable but heavily controlled, local data handling and auditability may matter more than convenience. Either way, the platform should reduce friction, not create a second job for the people running it.
The first things I would tighten before adding more features
If I were improving an existing platform rather than buying a new one, I would start with the parts that compound the fastest. First, make discovery and inventory trustworthy. If the platform does not know what is in the network, every other feature becomes less reliable. Next, make the telemetry clean enough to trust, because poor data quality is the fastest route to alert fatigue.
- Lock down accurate discovery and topology mapping.
- Set sane thresholds and correlation rules before expanding coverage.
- Put config backup and rollback in place for critical devices.
- Enforce role-based access, MFA and audit trails on the management plane.
- Build service-level dashboards before adding more executive reporting.
That sequence is boring in the best possible way: it gives you fewer surprises, less noise and a clearer operational picture. Once those foundations are stable, more advanced automation and analytics actually have something solid to build on.