The short version for busy teams
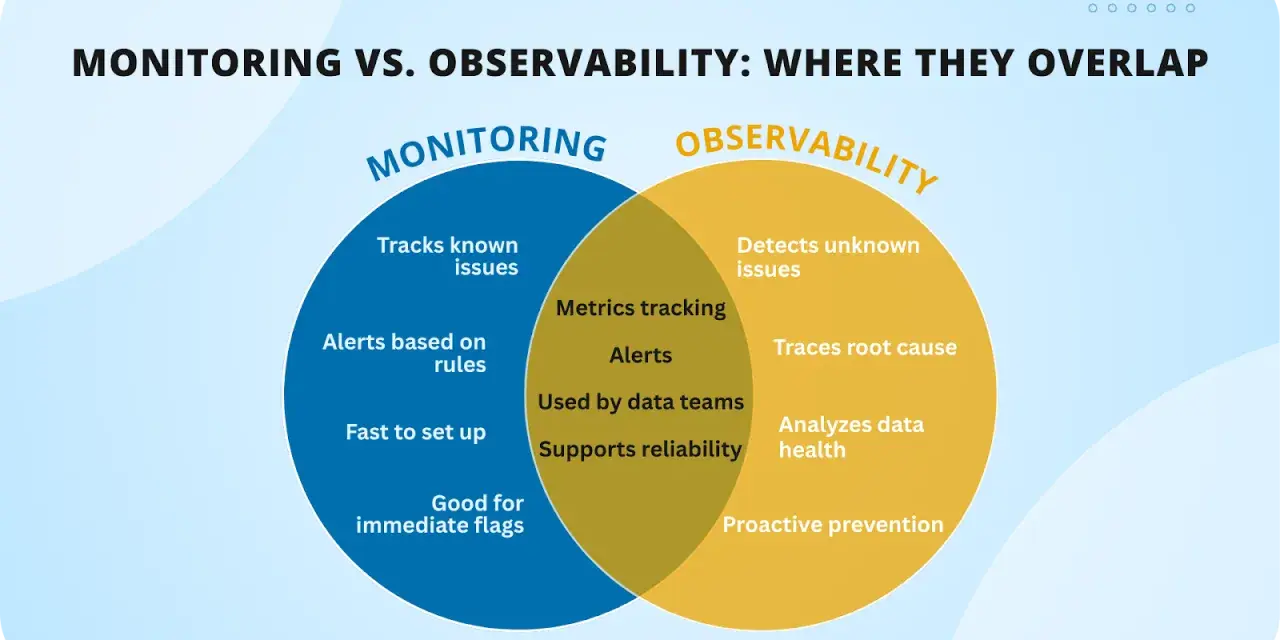
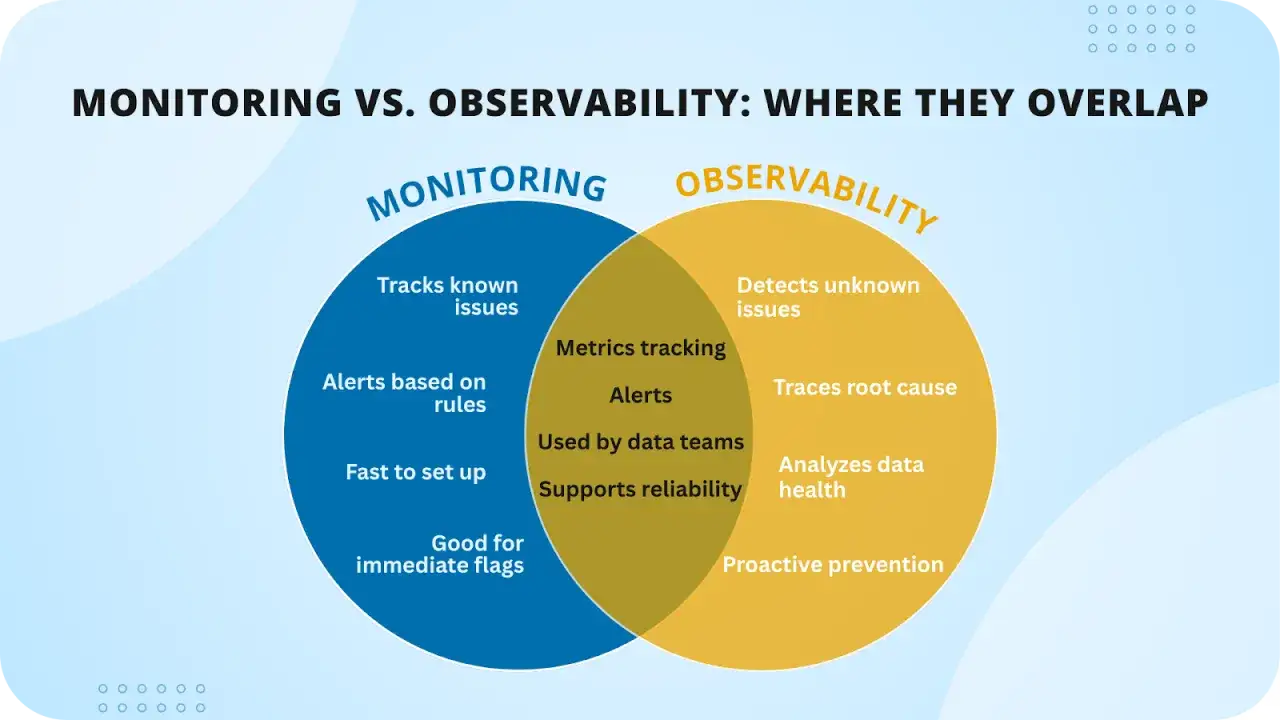
- Monitoring tells you whether something has changed; observability helps you explain why it changed.
- Monitoring is strongest for known failure modes, thresholds, alerts, and service health checks.
- Observability becomes essential when systems are distributed, dependencies are messy, or the failure mode is not already known.
- Good observability depends on good telemetry: metrics, logs, traces, and enough context to correlate them.
- Neither replaces the other. Monitoring without observability creates alert noise, while observability without monitoring gives you interesting data and weak detection.
- For most teams, the real goal is faster incident response and fewer blind spots, not choosing one label over the other.
Monitoring is about catching known failures quickly
I think of monitoring as the layer that tells you when a service has stepped outside the range you already understand. It is built to detect known problems: a CPU spike, a failed health check, an elevated error rate, a queue that is backing up, or an SSL certificate that is about to expire. That makes it reactive in a useful way, because it gives operators a chance to intervene before users feel the impact.
In practice, strong monitoring usually centres on a few things:
- Thresholds that say when a metric has crossed an acceptable line.
- Alerts that tell the right team something needs attention.
- Dashboards that let people scan service health at a glance.
- SLIs and SLOs, which keep measurements tied to user experience rather than vanity metrics.
That last point matters more than many teams expect. If the metric does not connect to what users actually feel, it becomes easy to optimise the wrong thing. I usually prefer monitoring that follows latency, availability, error rate, and saturation before I worry about more decorative charts. Once that foundation is in place, the next question is not just whether something is broken, but what is actually causing the behaviour you are seeing.
The practical difference in day-to-day operations
The cleanest way to separate the two is to ask what each one answers. Monitoring tells you what happened and when it happened. Observability helps you understand how the problem unfolded and why it happened in the first place. AWS describes the same split in its own documentation, and that framing still works because it is practical rather than theoretical.
| Dimension | Monitoring | Observability |
|---|---|---|
| Primary question | What changed? | Why did it change? |
| Main purpose | Detect known issues and alert on them | Investigate unfamiliar or cross-system problems |
| Typical signals | Metrics, logs, thresholds, alerts | Metrics, logs, traces, events, and rich context |
| Best fit | Simple systems and well-understood failure modes | Distributed systems, microservices, cloud platforms, complex dependencies |
| Operational outcome | Faster detection | Faster diagnosis and root cause analysis |
| Cost profile | Usually cheaper and easier to run | More data, more instrumentation, more storage and analysis overhead |
The important part is that observability is not a replacement for monitoring. It sits on top of it. If you cannot detect that something is wrong, you will not get very far trying to explain why it is wrong. In other words, monitoring creates the signal, and observability helps you interpret it.
The signals that make observability useful
Observability only becomes valuable when the telemetry is good enough to answer new questions. In most production systems, that means combining several signals rather than relying on one dashboard.
Metrics are the quickest way to understand trends. They compress behaviour into numbers over time, which is why they are so useful for spotting latency drift, error bursts, or resource saturation. Logs provide the event-level context you need when something unusual happens. They are slower to scan, but they usually explain what happened at a specific moment. Traces show how a request moved through the system, which makes them invaluable in distributed architectures where one user action can touch multiple services.
There are two more pieces I would not ignore. Events capture meaningful state changes such as deployments, scaling actions, feature-flag flips, or config updates. Profiles show where a service spends its time and resources, which is especially useful when a system is technically healthy but still performing badly. If you are running cloud-native tooling, OpenTelemetry is a common way to emit this telemetry without tying yourself too tightly to one vendor.
The practical lesson is simple: observability is not “more dashboards”. It is better correlation. If a request slows down, I want to see the spike in metrics, the log lines around that moment, the trace path through the dependent services, and the deployment event that may have triggered the shift. Without that connection, you are still guessing.
When monitoring is enough and when observability earns its keep
Not every system needs the same level of depth. A small internal service with a narrow job and a few clear failure modes may be perfectly fine with good monitoring, sensible alerts, and a couple of clean dashboards. If the service is predictable, the data model is simple, and the cost of instrumentation is higher than the value of the extra detail, monitoring alone may be the right call.
Observability starts to pay off when the system becomes harder to reason about from the outside. That usually happens when:
- you have multiple services talking to each other;
- requests cross cloud providers, third-party APIs, or managed platforms;
- latency or errors only appear under certain traffic patterns;
- incident response depends on understanding the chain of events, not just the alert;
- security, reliability, and performance all need to be analysed together.
That last point is relevant for a lot of teams in the UK, especially in fintech, connectivity, and security-heavy environments. A single “service is down” alert is not enough when you need to know whether the issue is a bad release, an auth problem, a network dependency, or a control that is behaving correctly but too aggressively. In that kind of environment, observability is not a luxury. It is the difference between fast diagnosis and prolonged uncertainty.
There is also a cost side to this decision. More telemetry means more ingestion, more storage, and more noise if you do not set retention and sampling rules. I do not think every service should collect everything forever. The goal is to collect enough to answer the questions that matter, not to build an archive of unused data.
The mistakes that make both look weaker than they are
Teams often blame the tools when the real problem is how they use them. I see the same mistakes again and again.
- They treat dashboards as observability. A graph is useful, but if you cannot pivot from that graph into logs, traces, or deployment context, you still do not understand the incident.
- They alert on symptoms instead of user impact. High CPU matters, but only if it affects latency, error rate, or availability in a way users can feel.
- They instrument too late. If you only add traces after the outage, you usually miss the path that caused the outage.
- They ignore label cardinality. Cardinality is the number of unique values a metric label can take, and it can quietly make a metrics system expensive or unusable if you track too much detail.
- They collect telemetry without ownership. Data that nobody reviews, tunes, or acts on becomes decoration.
- They confuse volume with insight. More logs do not automatically mean better understanding. Sometimes they just mean slower searching.
The most damaging mistake is assuming observability will magically fix weak architecture. It will not. If a system is tightly coupled, poorly named, or missing clear service boundaries, telemetry can reveal the mess, but it cannot remove the complexity. Good design still matters.
The rule I use before calling a system observable
My own test is straightforward: if I can ask a new production question and answer it without adding fresh debug code or manually stitching together half a dozen screens, the system is getting closer to observable. If I can only tell that something is broken, but not trace the path from symptom to cause, I still have monitoring, not observability.
That is why the strongest production setups usually combine both. Monitoring gives you fast detection and clear alerts. Observability gives you the context to explain what happened, isolate the root cause, and improve the system after the incident. For modern cloud services, connected platforms, and security-sensitive workloads, that combination is what keeps incident response grounded in evidence instead of guesswork.