Reliable systems need more than pretty dashboards. One part of the job tells you that latency has jumped or errors are rising; the other helps you work out why a payment service, login flow or API chain misbehaved in the first place. This article breaks down the real distinction between observability vs monitoring, shows where each one stops, and gives you a practical way to use both without bloating your stack.
The short version for engineering teams
- Monitoring tells you whether a known condition is healthy and whether you should alert.
- Observability helps explain a new, unclear or multi-service failure after the alert fires.
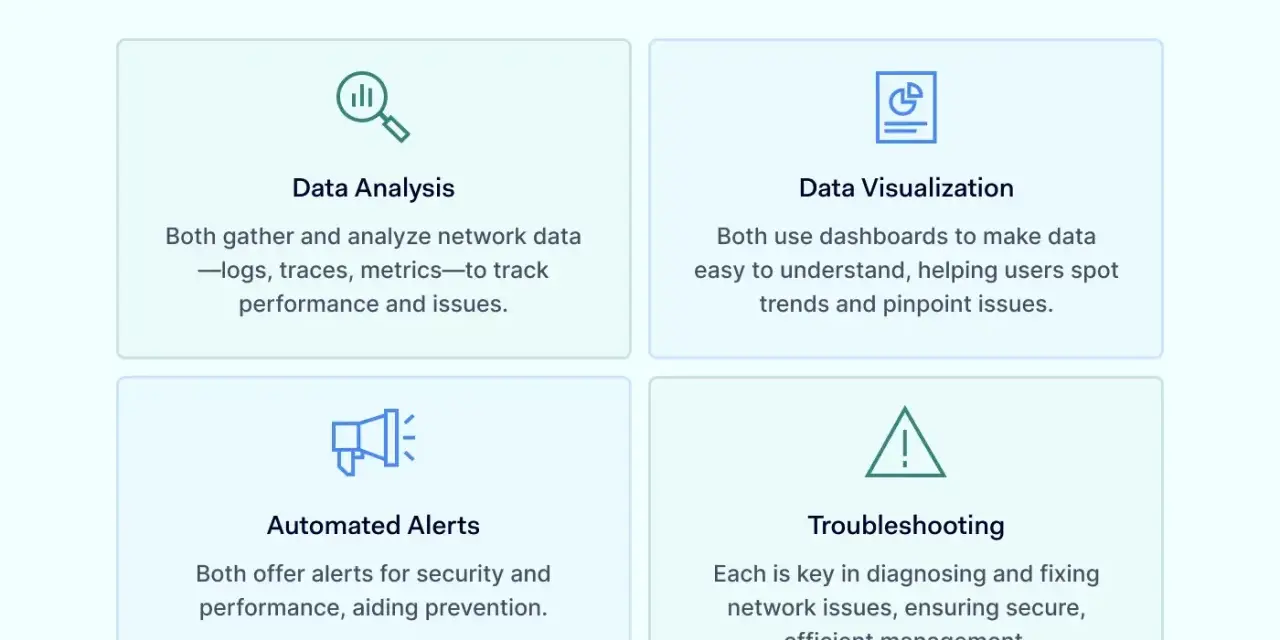
- Metrics, logs and traces are the core signals, but they do different jobs.
- Good monitoring is symptom-led; good observability is context-led.
- Most production teams need both, not one replacing the other.
What each practice is really for
Monitoring is the discipline of watching a system for expected failure modes. It answers questions like, “Is the service down?”, “Is error rate above the threshold?” and “Has response time drifted outside the acceptable range?”. In practice, that usually means dashboards, alerts, uptime checks and a small set of carefully chosen indicators.
Observability is broader. It is about making a system understandable from the outside so you can explain why something happened, not just that it happened. If monitoring is the smoke alarm, observability is the set of clues that tells you where the fire started and how it spread.
The easiest way to separate them is by the question they answer. Monitoring is strongest when you already know what “bad” looks like. Observability matters when the failure is new, hidden across services or too messy for a single threshold to explain. That distinction becomes more important as systems become more distributed, more automated and more security-sensitive. The next step is seeing how that plays out in a direct comparison.
Where observability and monitoring differ in practice
| Dimension | Monitoring | Observability |
|---|---|---|
| Primary goal | Detect known problems quickly | Explain unknown or complex problems |
| Typical signals | Mostly metrics and alert rules | Metrics, logs, traces and their relationships |
| Best question | Is the system healthy? | Why is the system behaving this way? |
| Best output | Alerts, dashboards, uptime status | Context, correlation, root-cause clues |
| Typical failure mode | Too many alerts or the wrong thresholds | Too much data without enough structure |
| When it shines | Known outages, SLO breaches, resource saturation | Distributed incidents, intermittent bugs, cross-service issues |
This is why I would never treat the two as competitors. Monitoring is what keeps the on-call rota sane. Observability is what keeps incident reviews short enough to be useful. One catches the symptom; the other helps explain the mechanism behind it. That leads naturally to the question teams usually get wrong: how do you build both without doubling the noise?
How to build both into one production stack
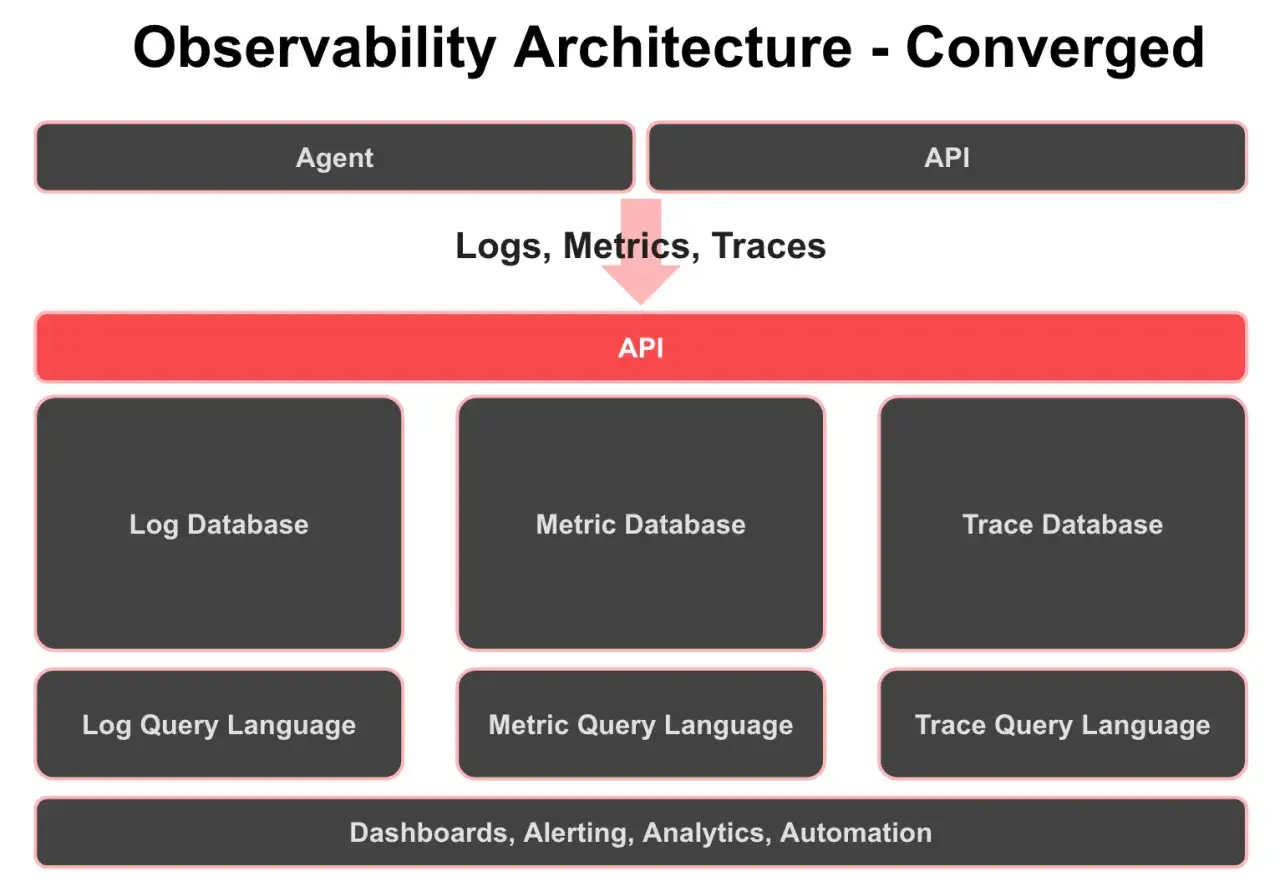
The cleanest approach is to start with a small monitoring layer and then add observability where the system genuinely needs more context. I usually recommend beginning with the four classic operational signals: latency, traffic, errors and saturation. They give you a compact picture of service health without turning every dashboard into a wall of noise.
Start with service levels, not tools
Before you buy or wire up anything else, decide what success looks like. Define a handful of service level indicators, or SLIs, such as request success rate, checkout completion, login latency or queue depth. Then turn the most important ones into service level objectives, or SLOs, which are the target ranges you actually care about. That keeps monitoring tied to customer impact rather than internal trivia.
Instrument the critical path first
Observability only works if the important paths are instrumented. Start with the user journey that matters most: sign-in, payment, search, device registration or order fulfilment. Emit traces for request flow, metrics for trends and structured logs for events with fields machines can query. A trace shows the path of one request through the system; a structured log records what happened at a specific point with enough context to search later.
Read Also: AWS NetFlow - Master VPC Flow Logs & Network Monitoring
Connect the signals with correlation IDs
A correlation ID is a shared identifier passed through related services so one request can be followed end to end. That one piece of discipline often cuts investigation time more than another dashboard ever will. If your logs, traces and metrics cannot be tied back to the same transaction, you have data, but not much observability.
In other words, monitoring protects your alerting baseline, while observability protects your debugging speed. Once that split is clear, the most common failure patterns become easier to spot.
The mistakes that create noise instead of insight
- Instrumenting everything at once. Teams often flood the stack with metrics before they know which paths matter. The result is expensive storage and no clearer diagnosis.
- Alerting on causes rather than symptoms. An alert that says “database CPU is 82%” may be useful for planning, but it is usually weaker than an alert that says “checkout latency is above target”.
- Keeping logs unstructured. Free-form text is fine for humans, but it is poor for correlation at scale. If you cannot query by tenant, region, request ID or error class, investigations slow down.
- Building dashboards without ownership. A dashboard nobody owns becomes decorative. Every panel should exist because someone uses it to make a decision.
- Confusing volume with value. More traces, more logs and more charts do not automatically create insight. If every incident still starts with “where do we begin?”, the stack is too noisy.
The fix is usually restraint, not more tooling. Pick the few signals that tell you when a user journey is broken, then add the extra context only where it shortens diagnosis. That matters even more once the stack extends beyond one application into cloud, security and AI services.
Why the difference matters in cloud, security and AI systems
In cloud-native environments, one user action often crosses several services, queues and managed dependencies. A simple monitoring alert may tell you that something is slow, but only traces and correlated logs reveal whether the bottleneck sits in an API gateway, a downstream database or an external dependency. That is why distributed systems make the observability side much more valuable than in a monolith.
Security teams also benefit from the split. Monitoring can spot an unusual spike in failed logins, outbound traffic or privilege changes. Observability helps tie those signals together, so you can see whether the event came from one compromised account, a misconfigured deployment or a broader attack pattern. In a modern security operation, context often matters more than raw volume.
AI and LLM applications raise the bar again. You are no longer only watching request latency and HTTP errors. You also need to understand prompt flow, retrieval quality, tool calls, token usage, fallback paths and safety filters. In 2026, that is a practical requirement, not a nice extra. If an AI workflow returns a weak answer, the real question is rarely “was the endpoint up?” It is usually “which stage of the chain degraded the output?”
That is the point where observability becomes more than an engineering luxury. It becomes the only realistic way to explain behaviour across systems that are dynamic, distributed and partly opaque. The final question is how to decide where to invest first.
A practical decision rule for building the right stack
My rule is simple. If you already know the failure mode and want to catch it fast, build monitoring first. If you need to explain a new issue across services, add observability where the investigation stalls. Most teams should do both, but not with equal weight everywhere.
- Use monitoring for uptime, SLO breaches, saturation and customer-facing symptoms.
- Use observability for incident triage, root-cause analysis and cross-service behaviour.
- Start with the highest-value transaction path, not the noisiest subsystem.
- Prefer fewer, better alerts over a large alert catalogue that nobody trusts.
- Review every incident for missing context, then instrument that gap once.
If I had to reduce the whole debate to one sentence, I would say this: monitoring tells you that something is wrong, observability helps you understand what is wrong and where to look next. The best teams do not choose between them; they use the simplest signal that answers the current question, then add richer telemetry only where it clearly improves diagnosis.