Key takeaways at a glance
- VPC Flow Logs are the closest AWS-native equivalent to NetFlow-style network metadata.
- The default aggregation window is 10 minutes; you can choose 1 minute, and Nitro-based instances effectively run at 1 minute or less.
- Flow logs can land in CloudWatch Logs, S3, or Data Firehose, so you can split live ops from long-term analysis.
- Expect roughly 5 minutes to CloudWatch Logs and about 10 minutes to S3 in typical delivery conditions.
- Network Flow Monitor adds near real-time latency, packet loss, retransmissions, and a health indicator when flow logs are not enough.
- Flow logs capture metadata, not payloads, so they are ideal for visibility and forensics-lite troubleshooting, but not packet inspection.
What AWS flow telemetry actually gives you
The first thing I tell teams is to stop expecting classic router-export NetFlow from AWS. The native model is closer to structured flow metadata: a 5-tuple summary, packet and byte counts, action status, TCP flags, and a set of contextual fields that help you understand which interface, VPC, subnet, or workload was involved. That is enough to answer most connectivity and security questions, but it is not the same as seeing packet payloads or application messages.
VPC Flow Logs are collected outside the network path, so enabling them does not add throughput or latency impact to your traffic. That matters in production, because you can turn them on for an incident, keep them running for audit, and avoid the usual fear that the observability tool is becoming part of the problem. The trade-off is that you are working from summaries, not raw packets, so some fields are only best-effort approximations and some details can be missing or inaccurate.
For me, the practical value is simple: flow logs tell you whether traffic exists, whether it was accepted or rejected, where it went, and how much of it moved. That makes them excellent for security groups, routing issues, NAT paths, east-west traffic, and unexpected egress. Once that baseline is clear, the next decision is where to send the data so it is actually usable.
How I would route the data in a useful way
AWS gives you three native destinations for flow logs, and I would not treat them as interchangeable. I usually split the pipeline into two jobs: operational visibility and historical analysis. CloudWatch Logs is the fastest way to look at a problem right now. S3 is the better long-term store. Firehose is the bridge if you need to forward the data into a SIEM, a lake, or another analytics platform.
| Destination | Best for | Strengths | Trade-offs |
|---|---|---|---|
| CloudWatch Logs | Live troubleshooting, metric filters, alarms | Fast to search, easy to wire into alerts, low friction for responders | Not ideal for heavy historical analytics or cheap long retention |
| S3 with Parquet | Trend analysis, investigations, retention | Cheap storage, SQL access with Athena, strong fit for centralised analysis | Not near real-time, and you need a query discipline |
| Data Firehose | Streaming into SIEMs or downstream data platforms | Decouples producers from consumers, useful in larger security stacks | Extra moving parts, and downstream costs can grow quickly |
When the dataset is going to live for weeks or months, I prefer S3 in Parquet. AWS documents that Parquet queries are typically 10 to 100 times faster than plain-text queries and can use about 20 percent less storage than Gzip-compressed text. That is a meaningful difference when the logs start to cover multiple accounts, several VPCs, and a long retention window. If you only need a quick operational view, CloudWatch is still the shorter path.
The other detail that matters is delivery timing. In typical conditions, flow logs reach CloudWatch Logs in about 5 minutes and S3 in about 10 minutes, although delivery is best effort and can slip. I usually plan around that delay instead of pretending the data is real time. Once the pipeline is in place, the next job is to read the fields without drowning in them.
Which fields matter most in practice
Most people over-focus on the volume of log lines and under-focus on the handful of fields that answer actual questions. I start with the fields that let me explain a change in behaviour, not just list network facts. The default format is often enough to begin with, but a custom format becomes useful when you know what you are trying to prove or disprove.
| Question | Fields I check first | What I am looking for |
|---|---|---|
| Why was traffic rejected? | action, dstport, tcp-flags | Blocked ports, broken security group rules, or traffic that never completed a handshake |
| Who are the top talkers? | srcaddr, dstaddr, bytes, packets | Noisy neighbours, runaway jobs, or unexpected egress growth |
| Is traffic crossing an intermediate hop? | interface-type, pkt-srcaddr, pkt-dstaddr, next-hop-interface-id | NAT gateways, endpoints, load balancers, or pod-to-node translation inside EKS |
| Did the collector miss data? | log-status | NODATA for quiet periods, SKIPDATA when records were skipped and need attention |
Those last two statuses are easy to ignore until you are under pressure. NODATA usually means there was no traffic in the interval. SKIPDATA is more serious because it means some records were not captured during the aggregation window, often because of an internal capacity constraint or error. I treat that as a data-quality signal, not as an innocuous footnote.
There is also a subtle but important reason to use a custom format: it keeps the data model aligned with the problem. If you only care about a handful of ports, a few key tags, and a route through a NAT gateway, there is no reason to drag every possible field through every query. The useful part starts when you turn these fields into repeatable checks and alerts.
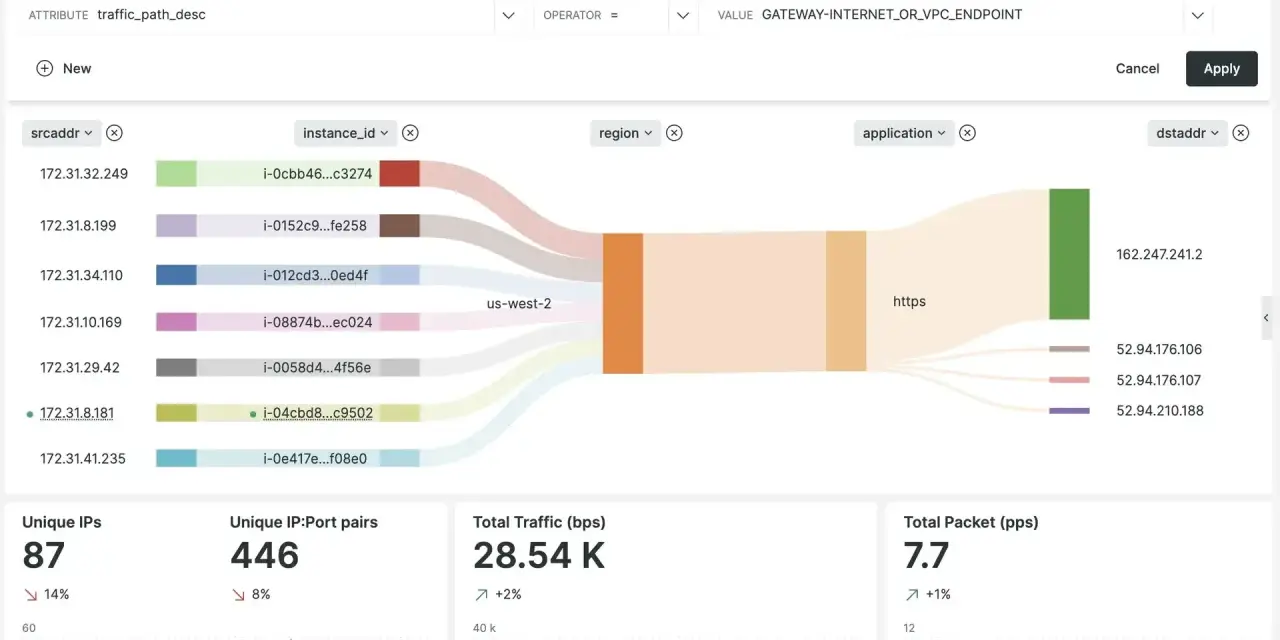
Turning flow logs into observability instead of storage
This is where the difference between logging and observability becomes obvious. A bucket full of flow records does not help much if nobody has a baseline, a dashboard, or an alerting strategy. I usually build around three views: traffic volume by environment, rejected connections by port, and top source-destination pairs by bytes. Those three views tell me whether the network is busy, whether it is refusing traffic, and whether the shape of the traffic changed after a deploy.In a mature setup, I want flow data correlated with the things that change network behaviour: security group edits, route table changes, autoscaling events, deployments, and tag changes. Tags matter more than people expect. If I can tie a flow to an application name, owner, or environment, investigation becomes much faster because I am not guessing which team owns the traffic spike. That is especially useful in multi-account estates where the same pattern appears in dev, staging, and production.
The alerts I find most useful are not flashy. A sudden spike in REJECT records on a port that should be quiet, a new destination that has never been seen from a sensitive subnet, or a jump in inter-AZ traffic after a release are all worth attention. I would rather get five high-signal alerts than one dashboard that no one opens. That is the moment where flow logs stop being a record of events and become operational evidence.
When the question changes from “what happened” to “why does it feel slow,” flow logs are only half the answer. That is where Network Flow Monitor earns its place.
When Network Flow Monitor is the better tool
VPC Flow Logs and Network Flow Monitor solve related but different problems. Flow logs give you the traffic summary. Network Flow Monitor gives you performance visibility: packet loss, retransmissions, round-trip time, and a network health indicator that tells you whether AWS appears to be part of the problem. For EC2 and EKS workloads that talk to AWS services or traverse AWS Regions, that is a more direct way to understand performance than a static flow record ever will be.
| Dimension | VPC Flow Logs | Network Flow Monitor |
|---|---|---|
| What it shows | Flow metadata, accept or reject, bytes, packets, ports | Latency, loss, retransmissions, path detail, network health indicator |
| Best use | Security analysis, audit trails, broad traffic visibility | Performance debugging and path troubleshooting |
| Latency of insight | Minutes, depending on destination | Near real-time |
| Collection model | Passive, outside the traffic path | Lightweight agents on compute resources |
I see Network Flow Monitor as the layer that answers the follow-up question after flow logs have shown me where traffic is going. If a workload suddenly gets slower, NFM helps me decide whether I should look at AWS path issues, application behaviour, or both. Its network health indicator is especially useful because it gives a quick binary clue: healthy or degraded. That is a much faster triage signal than scanning a pile of flow summaries for clues.
There is still a limit here: neither tool replaces packet capture or full protocol analysis when you need to inspect payloads, retransmission sequences, or application-layer behaviour in detail. The decision is not which tool is “better” in the abstract. It is which level of evidence you need for the incident in front of you. That distinction matters, because it decides whether you need metadata, metrics, or both.
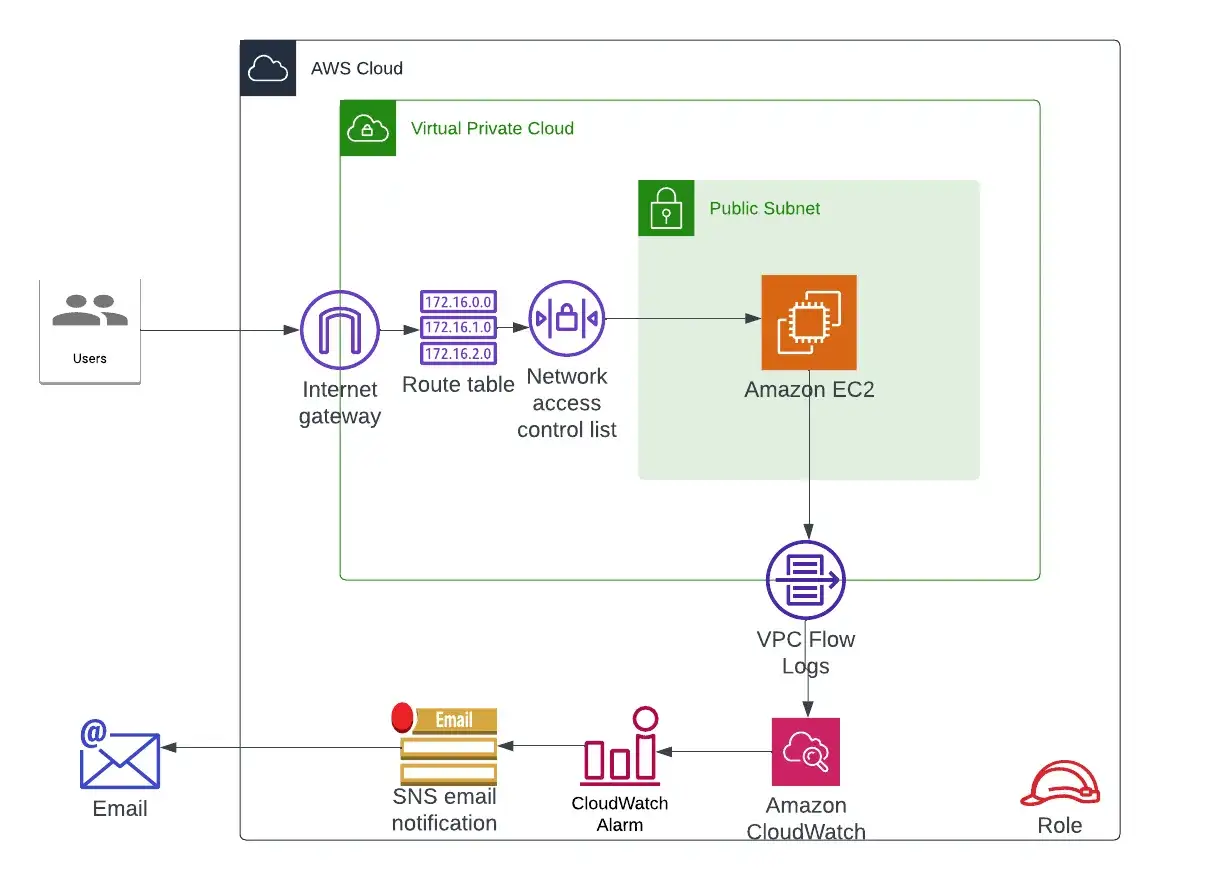
The rollout pattern I would use in a real AWS estate
If I were introducing this into a production environment, I would start small and deliberately. I would enable VPC Flow Logs on one or two high-value VPCs or subnets first, then choose the destination based on the audience: CloudWatch for responders, S3 for analysts, Firehose for a downstream security stack. I would not turn everything on everywhere just because the platform allows it.
- Start with the workloads that create the most ambiguity during incidents: shared services, internet-facing tiers, and private workloads with strict security groups.
- Use a 1-minute aggregation window where the environment is latency-sensitive or the instance type makes that worthwhile; keep 10 minutes where the goal is broad, lower-volume coverage.
- Keep a live operational path in CloudWatch and a cheaper historical path in S3, preferably in Parquet if you plan to query the data regularly.
- Add Network Flow Monitor only for paths where latency, retransmissions, or packet loss would change your troubleshooting decision.
- Review SKIPDATA, tag coverage, and the time lag between traffic and log availability as part of normal data quality checks.
If your downstream tooling only speaks NetFlow or IPFIX, I would treat AWS flow data as the source of truth and then translate it for the tool, rather than forcing the AWS design to mimic a legacy collector. In most environments, that produces a cleaner monitoring model and fewer surprises during incidents. For me, the simplest robust stack is still the most useful one: VPC Flow Logs into S3 for history, CloudWatch for live detection, and Network Flow Monitor on the paths where performance really matters.