The essentials to keep in view
- Start with the customer journeys and service targets that actually matter.
- Use metrics, logs, and traces for different jobs instead of expecting one signal to do everything.
- Page only on issues that someone can fix right now.
- Split operational dashboards from reporting dashboards so each view stays useful.
- Control retention, sampling, and redaction before telemetry costs and privacy risks grow.
- Adapt the monitoring model to containers, serverless functions, and managed services rather than forcing one template everywhere.
Start with the service outcomes that matter
I usually begin by asking what failure looks like from the user's side. That means identifying the few journeys that would hurt most if they slowed down or failed, then defining SLIs and SLOs around them. An SLI is the measurement, an SLO is the target, and an SLA is the external promise; mixing them up is one of the fastest ways to build pretty dashboards that do not protect anything.
- Availability tells you whether the service is there when someone needs it.
- Latency tells you whether the experience feels fast enough to trust.
- Error rate shows whether requests, dependencies, or retries are failing.
- Saturation shows whether CPU, memory, queues, or connection pools are approaching their limits.
I find it useful to treat those as the first line of defence, because they quickly reveal whether a system is healthy enough for real traffic. Once that is clear, the telemetry design becomes much simpler, which is exactly why the next step is to connect the data streams rather than let them drift apart.
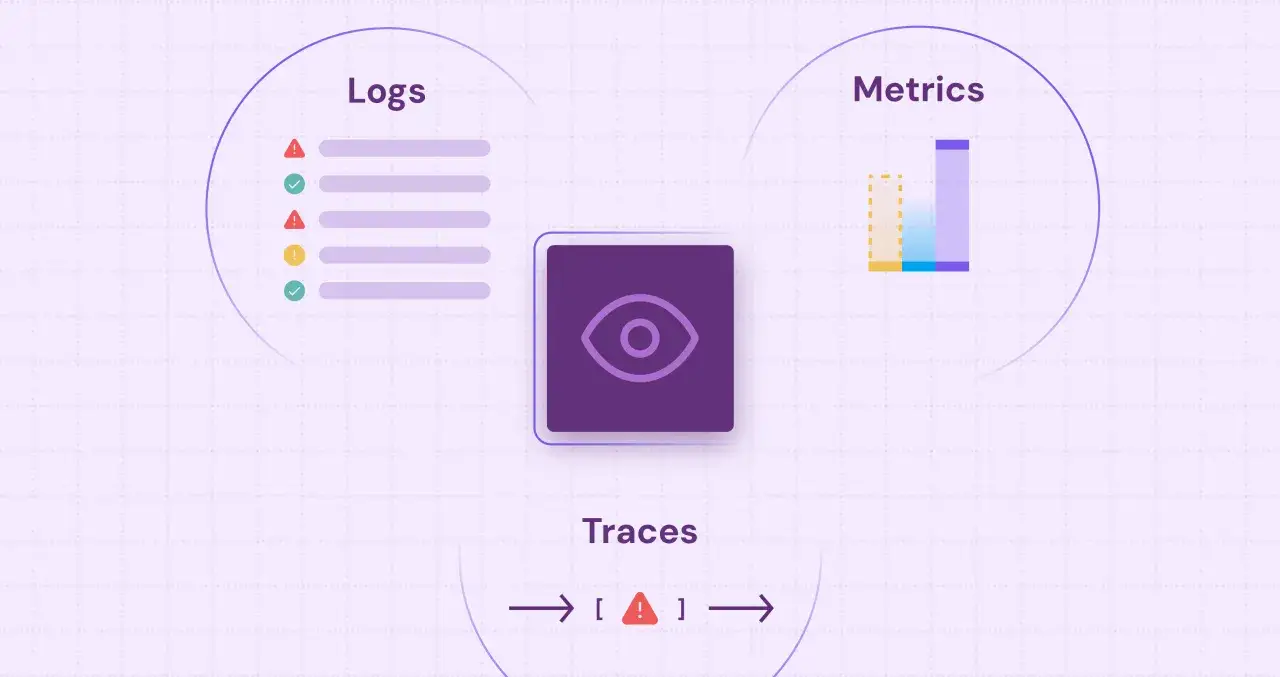
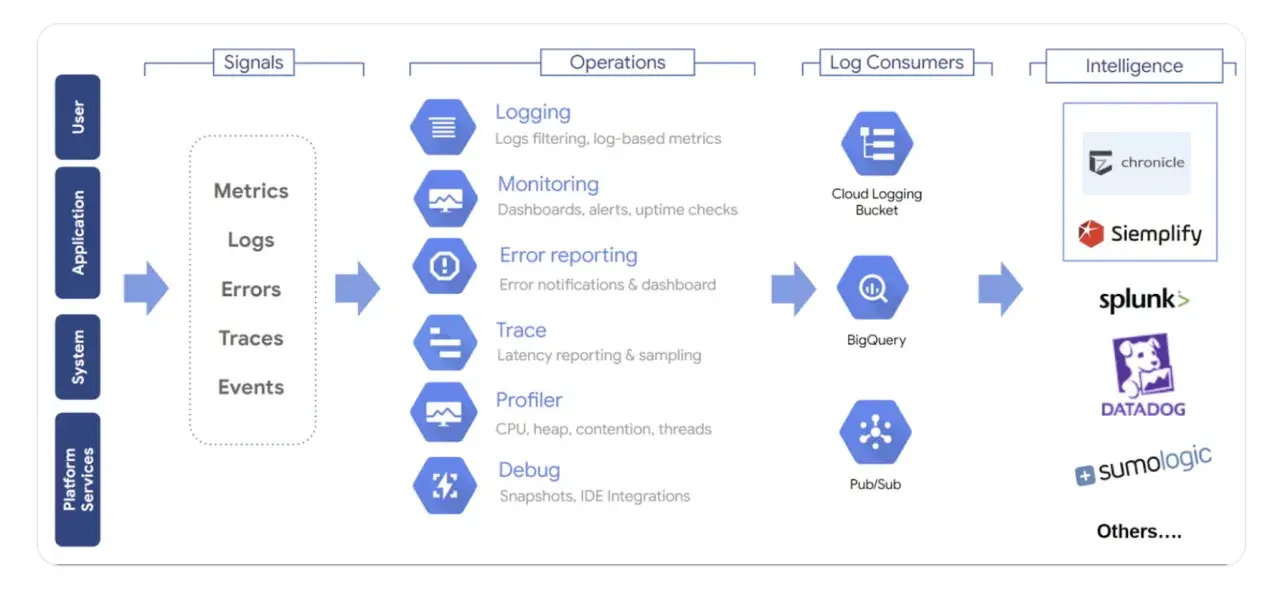
Instrument metrics, logs, and traces as one system
If monitoring is the alarm, logs are the evidence and traces are the map. I treat those three signals as complementary: metrics show patterns, logs explain events, and traces show how a request moved through the system. That is why the cloud monitoring stack works best when the signals share IDs, timestamps, and service names rather than living in separate silos.
| Telemetry type | What it answers best | Where it falls short |
|---|---|---|
| Metrics | Is the system trending in the right or wrong direction? | They are fast to scan, but they rarely explain root cause on their own. |
| Logs | What exactly happened at the moment of failure? | They can become noisy and costly if everything is logged at full detail. |
| Traces | Where did a request slow down or break across services? | They depend on disciplined instrumentation and sensible sampling. |
Use correlation IDs everywhere
A correlation ID is a shared token that follows a request through each service, so a log line in one component can be matched to a trace span in another. Without that link, investigation turns into guesswork, especially in distributed systems where one user action can touch several services in a few hundred milliseconds. I treat correlation as non-negotiable for anything beyond the simplest workload.
Read Also: IPFIX Collector Guide - Maximize Network Visibility
Sample traces without blinding yourself
Full-fidelity tracing is rarely affordable for high-volume paths, so sampling has to be deliberate. My default approach is to keep full detail on low-volume, high-value journeys and reduce the sample rate on hot paths, then increase sampling temporarily during incidents or risky releases. The goal is not perfect coverage; it is enough visibility to follow the expensive or user-facing path when something goes wrong.
Once telemetry is tied together, the real test is whether alerts turn that visibility into action instead of more noise.
Make alerts actionable, not constant
An alert should answer three questions immediately: what is broken, who owns it, and what should happen next. If it cannot answer those, it belongs in a dashboard, a ticket, or a report, not a page. A noisy alert is not a signal; it is debt that someone on call will pay later.
| Alert tier | Use it for | Expected response |
|---|---|---|
| Page | Customer-facing outages, data-loss risk, or severe degradation | Immediate on-call action |
| Ticket | Capacity drift, repeated errors, or performance degradation that is not urgent | Same-day or next-business-day triage |
| Info | Audit signals, housekeeping, and low-risk anomalies | Review during normal operations |
- Use thresholds for known failure modes. They are simple and easy to explain when the pattern is stable.
- Use anomaly detection for shifting baselines. It helps when traffic, seasonality, or deployments make fixed thresholds brittle.
- Deduplicate aggressively. One root problem should not trigger twenty pages.
- Attach context to every alert. The best pages include the impacted service, recent changes, and a runbook link.
Good alerting is selective by design. When that layer is stable, the next challenge is making sure people can read the system quickly, which is where dashboards earn their keep.
Build dashboards for decisions, not decoration
A single dashboard rarely works for operators, service owners, and leadership, because each group asks a different question. The on-call view should help someone decide whether to act in minutes; the owner view should show trends over days; the leadership view should show whether reliability and cost are moving in the right direction. When all three are mixed together, the page becomes decorative instead of operational.
- Operator dashboards should show live latency, error rates, saturation, queue depth, and dependency health.
- Owner dashboards should highlight release impact, recurring incidents, and trends that point to structural weakness.
- Business dashboards should show SLO attainment, customer impact, and the service-level cost signals that matter.
I prefer dashboards that answer one question per screen. If a chart does not help someone decide whether to page, investigate, or ignore, it belongs somewhere else. That discipline matters even more once telemetry starts to scale, because cost and privacy problems usually arrive faster than teams expect.
Keep telemetry cost and privacy under control
Telemetry gets expensive when teams store too much detail for too long, or when high-cardinality labels multiply series until the bill starts to look like a production incident. Logs usually create the biggest storage and search costs, while traces can become painful if sampling is left on autopilot. I prefer to make cost decisions early, before the first incident proves how messy the defaults are.
- Use retention windows intentionally. A common starting point is 7-14 days for detailed logs, with longer retention only where the business case is clear.
- Aggregate older metrics. Keep fine-grained data where it helps debugging, but downsample historical data for trend analysis.
- Redact sensitive fields early. Secrets, tokens, personal data, and payload fragments should not enter the telemetry pipeline unless there is a very specific reason.
- Watch cardinality. Labels such as full user IDs, raw URLs, and request identifiers can explode the number of series you store and query.
- Review cost and value together. If a signal has not helped with an incident, a release, or a planning decision for months, it probably needs to be cut back.
For UK teams, that discipline also helps keep telemetry aligned with data-handling expectations across suppliers and regions. Once the data is under control, the next question is how the pattern changes across modern cloud workloads.
Adapt the pattern to the workload you actually run
Containers, serverless functions, and managed services all fail differently, so the same monitoring template will miss something important in each of them. I like to start with the failure mode that the platform hides most easily, then build from there. A stack that looks healthy at the node level can still be failing badly at the request level, and that gap is where many teams get surprised.
| Workload type | What I watch first | Common mistake |
|---|---|---|
| Containers and Kubernetes | Pod restarts, node pressure, rollout health, autoscaling behaviour, and service-to-service latency | Watching CPU only and missing scheduling or networking issues |
| Serverless | Cold starts, throttles, concurrency limits, timeout rates, and downstream dependency latency | Ignoring invocation-level failures because the platform feels abstracted |
| Managed services | Quotas, replication lag, connection limits, and service health events | Assuming the provider metrics alone will tell the whole story |
| Hybrid and multi-cloud | Tag consistency, network paths, ownership boundaries, and cross-platform correlation | Fragmenting telemetry by team, account, or vendor |
The pattern is simple: monitor the thing that breaks first, not the thing that is easiest to graph. That mindset becomes much more useful when monitoring is connected directly to incident response and release discipline.
Make monitoring part of incident response and releases
The best monitoring systems do not sit beside operations; they are woven into it. I want every critical alert to open a runbook, every release to leave an annotation, and every synthetic check to mirror a path a real user would take. That turns telemetry from a passive record into an operational control system.
- Attach a named owner and a runbook link to every page.
- Annotate deployments automatically so spikes line up with change events.
- Use synthetic checks for the journeys that matter most, such as sign-in, search, or checkout.
- Review alert history after incidents and delete or merge the alerts no one used.
- Run short game days so the team can practise reading the data under pressure.
When the monitoring layer is tied to incident response, the team spends less time asking where to look and more time fixing the actual fault. That leaves only the rollout order, which matters more than most teams admit.
The rollout order that keeps the first version useful
- Define the top three to five journeys and their SLOs.
- Instrument metrics and logs on the services that carry those journeys.
- Add traces to the slowest cross-service paths.
- Set up three alert classes: page, ticket, and info.
- Agree on retention, sampling, ownership, and dashboard reviews.