How AI turns observability into an early warning system
- AI adds pattern recognition on top of telemetry, so teams see weak signals earlier instead of waiting for a hard threshold to fail.
- Monitoring and observability are not the same thing: monitoring tells you something is wrong, while observability helps explain why it is wrong.
- OpenTelemetry remains the most practical foundation because it standardises traces, metrics, and logs with shared context.
- The biggest wins are operational: less alert noise, faster triage, better incident summaries, and earlier capacity warnings.
- The biggest risks are still human problems: poor instrumentation, missing context, weak ownership, and overconfidence in automated recommendations.
Why AI makes observability more actionable
In classical monitoring, I set thresholds and wait for them to break. In AI-assisted observability, I still care about thresholds, but I also want the platform to notice weak signals, correlate them across services, and explain the likely path from symptom to cause. That matters most in distributed systems, where a slow query, a deployment, and a network issue can look unrelated until you line them up.
The easiest way to think about it is that monitoring answers “is something wrong?”, while observability answers “what is happening and why?”. AI compresses the time between those two questions by clustering events, learning baselines, and highlighting the parts of the stack most likely to explain the change. Recent Grafana Labs survey data support that shift: anomaly detection is the top AI use case, and 92% of respondents see value in surfacing anomalies before downtime.
| Capability | Traditional monitoring | AI-assisted observability |
|---|---|---|
| Primary job | Alert on known conditions and thresholds | Surface unknown patterns, weak signals, and context |
| Signal handling | Often isolated metrics or rule-based alerts | Correlates logs, metrics, traces, deploys, and incidents |
| Investigation | Mostly manual correlation by engineers | Ranks likely causes and reduces search time |
| Response style | Page a human when a rule trips | Suggests likely root cause, deduplicates noise, and can open a case |
| Main risk | Missing unknown failure modes | False confidence if the underlying telemetry is weak |
The useful part is not the model itself; it is the way the model sits on top of a telemetry pipeline, which is where the real design work starts.
How the telemetry pipeline turns into insight
AI is only useful when it sits on top of a disciplined telemetry pipeline. OpenTelemetry is the obvious starting point because it standardises traces, metrics, and logs with shared context, which gives the model something consistent to reason over. Without that foundation, the system spends too much time guessing what the data means and too little time helping the engineer.
- Collect the right signals. Pull in application telemetry, infrastructure data, deployment events, and dependency information.
- Enrich the data. Add service name, version, region, tenant, request ID, and ownership metadata so the platform can connect events accurately.
- Build baselines. Learn normal behaviour by service, endpoint, workload, and time window instead of comparing everything to one global average.
- Detect anomalies and change points. Flag deviations in latency, error rates, traffic shape, saturation, or unusual request paths.
- Correlate likely causes. Link the anomaly to a deploy, config change, dependency failure, or traffic shift.
- Summarise the evidence. Turn the findings into a short explanation that an on-call engineer can act on quickly.
Under the hood, teams usually combine statistical anomaly detection, clustering, forecasting, and LLM-based summarisation. The statistical layer catches deviations, clustering cuts noise, and the language layer turns the mess into something an on-call engineer can read quickly. The best systems still keep a human in the loop, because confidence scores are useful but not the same thing as proof.
That pipeline is what makes the next section practical: once the data flow is sound, AI starts paying off in specific operational scenarios rather than in vague “smart platform” promises.
Where it pays off in production
The strongest use cases are operational, not cosmetic. AI helps when the signal volume is high, the stack changes fast, and the cost of a slow diagnosis is real.
- Alert deduplication and noise reduction. Related alerts can be clustered into one incident view, which reduces paging storms and keeps engineers focused on the real problem.
- Faster root cause analysis. The system can trace dependencies, rank suspect services, and point to the change most likely to have started the issue.
- Predictive capacity and performance management. Trend detection can warn about saturation, queue buildup, or latency drift before users feel it.
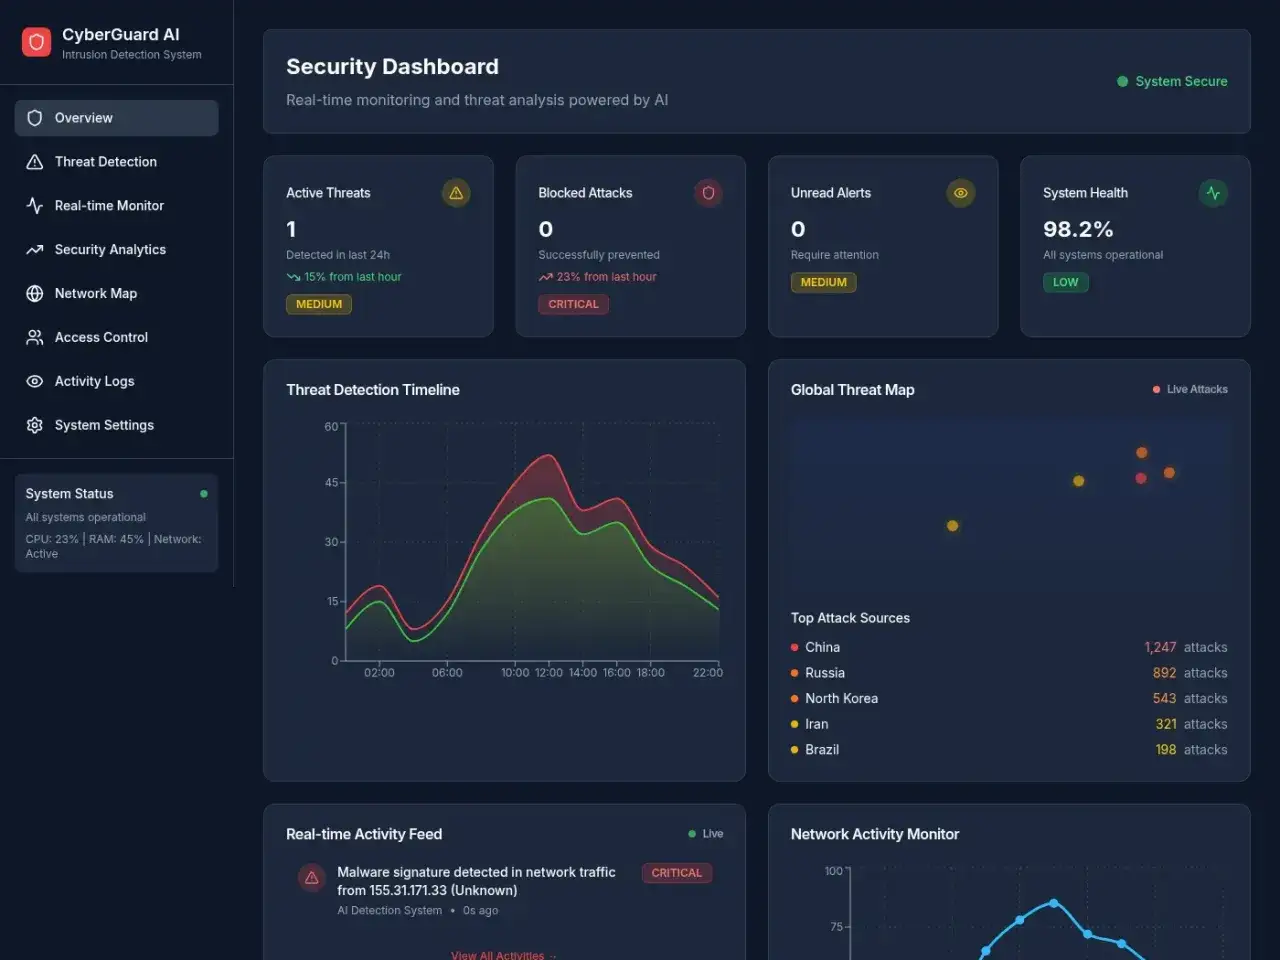
- Security and abuse detection. Unusual request patterns, traffic spikes, or odd service-to-service behaviour can stand out more quickly when AI compares them to normal behaviour.
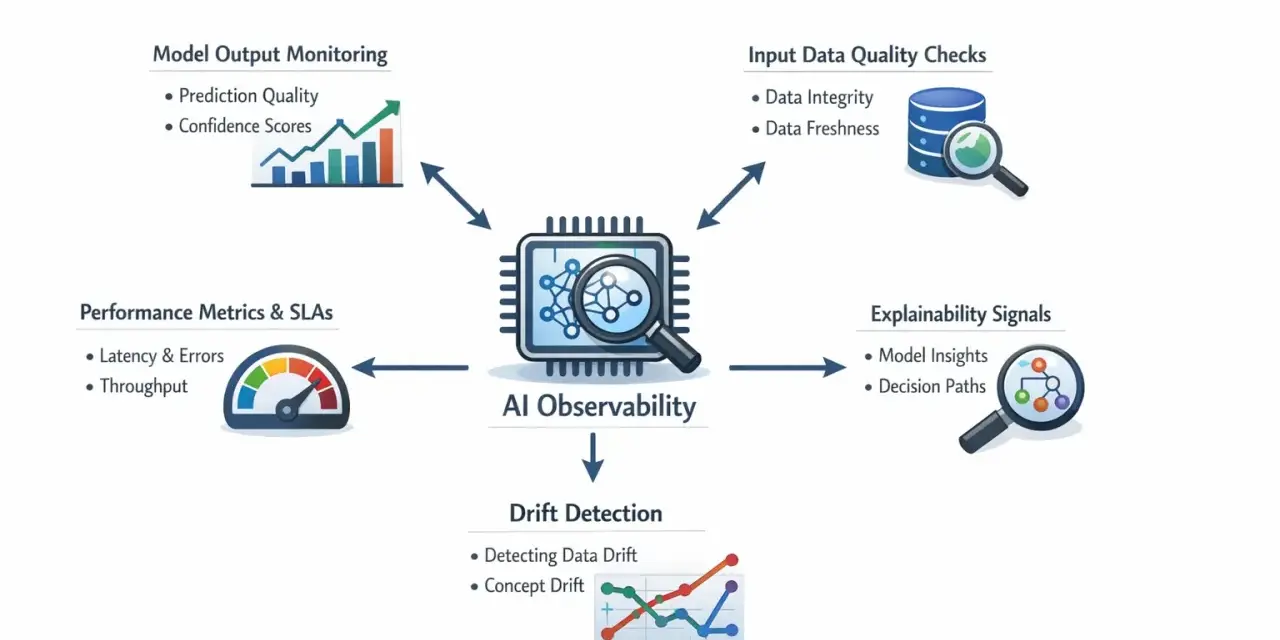
- AI application monitoring. If your product uses models or agents, observability can also track quality drift, tool failures, and unsafe output patterns, not just infrastructure health.
I also see value after the incident is over. Good systems can summarise the timeline, extract the important deployment events, and turn post-incident notes into a reusable narrative. That saves time in the next incident, and it is often where teams feel the benefit first.
What to check before you deploy it
Most disappointments start with procurement, not algorithms. IBM’s 2026 observability trend analysis points in the same direction: observability has to become more intelligent, more cost-effective, and more open-standard friendly. I agree, but I would add a stricter test: the tool has to fit your telemetry, your incident workflow, and your data boundaries before it earns a place in production.
- Instrumentation coverage. If your critical services are only partially instrumented, AI will simply amplify blind spots.
- Context enrichment. Add deploy version, region, feature flag state, service ownership, and customer tier so the platform can compare like with like.
- Explainability. I would ask whether the tool shows evidence, confidence, and the exact signals behind its recommendation.
- Retention and sampling. Too little history breaks trend detection; too much raw data without policy becomes expensive quickly.
- Workflow integration. Alerts should land in the systems the team already uses, not in another isolated console that nobody opens.
- Privacy and residency. For UK teams, decide early where telemetry is stored, who can see it, and how long it is retained.
That is also why OpenTelemetry matters so much in practice. It reduces backend lock-in, keeps the signal model portable, and makes future platform changes less painful than a proprietary instrumentation stack would.
Once those basics are in place, the remaining question is not whether AI can help, but where it can still mislead you.
Where the limits and failure modes show up
I am cautious about any pitch that treats AI as a shortcut around observability fundamentals. If the data is noisy, the model will be noisy. If the traces are missing context, the explanation will look precise while still being wrong. And if the team has not agreed on ownership, automation only moves confusion faster.
- Garbage in, garbage out. Bad instrumentation produces confident-looking nonsense.
- Over-automation. Helpful suggestions become dangerous when they mutate into production changes without human review.
- Sampling loss. Aggressive sampling can remove exactly the evidence the model needs to understand the incident.
- Weak baselines. Generic patterns do not fit seasonal traffic, release spikes, or event-driven workloads very well.
- Polished but unsupported narratives. LLM copilots can produce tidy incident write-ups that sound right even when the evidence is thin.
I trust AI to rank, cluster, and summarise before I trust it to remediate. That is not pessimism; it is a sensible boundary. The practical goal is to reduce mean time to understand without increasing false confidence.
With those limits in mind, the best way to roll this out is incrementally and with hard metrics attached.
A rollout path I would use in 2026
For most teams, I would avoid a big-bang observability rewrite. A tighter path works better:
- Start with one high-value service. Pick something user-facing, frequently deployed, and painful to debug.
- Standardise the telemetry first. Make sure traces, metrics, logs, and deployment events share enough context to be correlated.
- Measure the baseline. Track MTTR, alert volume, triage time, and the percentage of alerts that end up being noise.
- Turn on anomaly detection and correlation. Keep the scope narrow until you can show a real reduction in investigation time.
- Expand automation only after trust is earned. Let the system suggest and summarise before it is allowed to trigger any action.
Used this way, AI does not replace observability; it makes it practical at scale. The teams that get value from it are usually the ones that begin with clean telemetry, modest automation, and a strict human review loop, then expand only when the numbers improve.