The practical read on the visibility stack
- It is better thought of as a network observability platform than as one standalone tool.
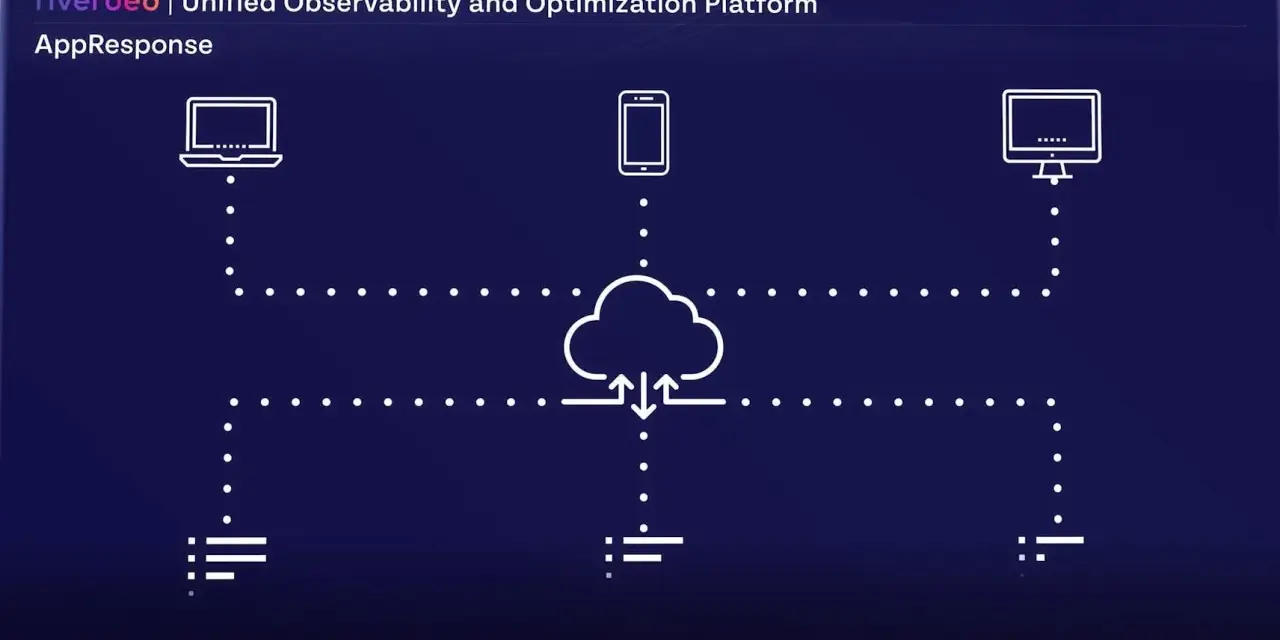
- NetIM handles infrastructure health and topology-aware monitoring, NetProfiler handles flow analysis, and AppResponse adds packet-level troubleshooting.
- Riverbed IQ sits above those signals and turns them into correlated insight and automated runbooks.
- The strongest use cases are hybrid networks, SD-WAN, cloud connectivity, and distributed teams that need faster root-cause analysis.
- The main tradeoff is operational depth: you gain visibility, but only if your telemetry, topology, and reporting are properly maintained.
What Riverbed Alluvio actually means in 2026
By 2026, I would not treat Riverbed Alluvio as a single product you install and forget. Riverbed Alluvio is better understood as the older naming layer around Riverbed’s observability portfolio, with the practical work now centered on network observability, NetIM, NetProfiler, AppResponse, and Riverbed IQ. Riverbed’s current product pages describe the stack as full-fidelity telemetry across packets, flows, infrastructure, endpoints, and digital experience, which tells you exactly what kind of problem it is meant to solve. That distinction matters because monitoring and observability solve different problems. Monitoring tells you that a device or service is unhappy; observability is what helps you trace the chain of cause, especially when the fault sits between a branch site, an SD-WAN path, a cloud edge, and the application itself. I read Riverbed’s lineup as an attempt to keep those layers in one operational model.That sets up the real question: which signals carry the most value when you are trying to isolate a network problem quickly?
Why packet, flow and topology data still matter
I rarely see a serious network issue resolved with only one data type. Packet, flow, and infrastructure telemetry answer different questions, and the value comes from joining them instead of forcing them into one dashboard view.
| Signal | What it tells you | Best use |
|---|---|---|
| Packets | What actually happened on the wire, including retransmissions, latency clues, and session behavior. | Deep troubleshooting, forensic work, and proving where an application exchange degraded. |
| Flows | Who talked to whom, how much traffic moved, and how patterns changed over time. | Capacity analysis, traffic baselining, anomaly spotting, and security context. |
| Topology and infrastructure | Which devices, interfaces, links, and configurations are part of the path. | Finding whether the issue sits in the network layer rather than the application itself. |
| User experience signals | How the issue shows up from the user or endpoint perspective. | Separating “the app is slow” from “the path is slow” and prioritising impact. |
That mix is why Riverbed keeps talking about full-fidelity telemetry and no sampling. In practice, the point is not a marketing slogan; it is that you are less likely to miss the short-lived degradation that causes the user complaint, then disappears before a sampled tool catches it. Once you accept that logic, the next step is to understand how each Riverbed component contributes to the picture.
How the Riverbed components fit together
When I map the platform for teams, I use a simple mental model: collect the right signal at the right layer, then let the correlation engine decide what matters first.
| Component | What it sees | What it answers | Where it is most useful |
|---|---|---|---|
| NetIM | Infrastructure health, topology, paths, configuration change, and device status. | Which device, link, or site degraded first? | Branch networks, core infrastructure, path analysis, and config-driven incidents. |
| NetProfiler | Flow data and traffic patterns across hybrid, multi-cloud, and SD-WAN environments. | What traffic changed, and which conversations are driving the issue? | Usage analysis, traffic baselining, anomaly detection, and security investigations. |
| AppResponse | Packet-level detail and application exchange behaviour. | What happened inside the transaction when the slowdown occurred? | Deep packet troubleshooting and proving root cause at session level. |
| Riverbed IQ | Correlated observability data and investigative context. | Which incident should be handled first, and what is the likely path to resolution? | Incident correlation, runbooks, and faster triage across teams. |
The practical win here is not just breadth. It is that a service desk, a NetOps team, and a security analyst can all start from the same evidence, then branch into their own investigation path without rebuilding the case from scratch. That shared view becomes especially useful when you are balancing branch, cloud, and remote-user traffic.
Where it helps most in hybrid and multi-cloud operations
The stack is strongest when the problem spans more than one domain. That is why it fits hybrid estates so well: branch connectivity, WAN optimisation, SD-WAN overlays, cloud interconnects, remote work, and the sort of path changes that make a slow application look random until you plot the route end to end.
- Branch-to-cloud latency spikes: flow and path visibility show whether the issue is transport, a congested link, or the application path.
- Intermittent slowness: packet evidence helps catch retransmissions, jitter, and session resets that trend lines can hide.
- Change-related outages: infrastructure monitoring and config comparison expose the moment a routing or device change breaks the chain.
- Security-led investigations: flow history gives context for suspicious traffic patterns before you pull packet detail.
- UK distributed estates: local offices, regional branches, and cloud services often fail in different ways, so a single-stack view is easier to operate than a pile of separate tools.
In other words, the platform pays off when the question is not “is the network down?” but “which part of the path degraded first, and who saw it before users did?” That is also where you start to feel the tradeoffs.
What to check before you commit to it
The biggest mistake I see is buying deep visibility and then treating it like a light-touch SaaS monitor. This kind of platform rewards discipline: you need sane topology grouping, clear ownership of data sources, and enough process to keep secure publishing, reporting, and access control tidy.
| Good fit | Less ideal fit | Why |
|---|---|---|
| Hybrid WAN, SD-WAN, and branch-heavy networks | Small environments with only a few dependencies | The platform earns its keep when path complexity is real. |
| Teams that need faster root-cause analysis | Teams that only want a lightweight status board | Its value is in correlation, not in simple green-or-red monitoring. |
| Security and NetOps teams that share incidents | Organisations with no process for ownership or escalation | Shared evidence helps, but only if someone owns action. |
| Environments where topology and configuration changes matter | Workloads dominated by code, database, or SaaS application issues | Network visibility will not replace application-layer observability. |
Riverbed’s NetIM guidance also makes a very practical point: once topology views grow large, they become hard to read unless you group devices and drill down deliberately, and its viewer documentation points to a 1,000-visible-device ceiling. That is a good reminder that visibility at scale still needs design. You are not just buying data; you are buying a way to organise it.
The decision rule I would use for this platform
If I had to compress the whole thing into one rule, I would say this: choose the Riverbed stack when you need network visibility that can survive hybrid complexity and still produce evidence you can act on. It is a strong fit for organisations that care about faster root-cause analysis, SD-WAN and cloud path visibility, and a shared operational view across network and service teams.If your world is mostly application code, database performance, or a small environment with limited interdependencies, the platform may be more than you need. But if your real pain is that nobody can agree where the slowdown begins, Riverbed’s observability model is built for that exact argument. For me, that is the clearest reason it still matters in 2026.