When a service slows down or fails in a way logs cannot explain, I want to see what actually moved across the network. Deep packet analysis is useful because it exposes handshake failures, retransmissions, protocol mismatches, and timing problems that higher-level telemetry often smooths over. In observability and monitoring work, that makes it less of a niche forensic tool and more of a practical way to prove where the break really is.
What matters most before you start capturing traffic
- Packet inspection is best when you need to prove whether the problem sits in DNS, TLS, routing, retransmission, or the application itself.
- It works best when combined with traces, metrics, and logs rather than used alone.
- Capture filters reduce what you store; display filters help you explore what you already captured.
- Encrypted traffic shifts the job from payload reading to endpoint, timing, and metadata analysis.
- In the UK, packet captures should be treated as sensitive operational data and governed accordingly.
What packet-level inspection shows that logs miss
Logs tell me what an application believes happened. Packets tell me what actually crossed the wire. That difference matters when the failure is outside the code path, in the transport layer, or in a dependency the app only sees indirectly.
In practice, I use packet data to answer questions like these:
- Did the client ever reach the right destination after DNS resolution?
- Did the TCP or TLS handshake complete, or did it stall halfway through?
- Are packets being retransmitted because of loss, congestion, or path instability?
- Is the payload being rejected because the client and server disagree on protocol version, framing, or cipher suite?
- Is the latency real, or is it just the result of buffering, retransmission, or an overloaded link?
The practical lesson is simple: packets are best for proving the mechanics of failure, not for replacing the rest of observability. That becomes clearer once I place them inside the larger monitoring stack.
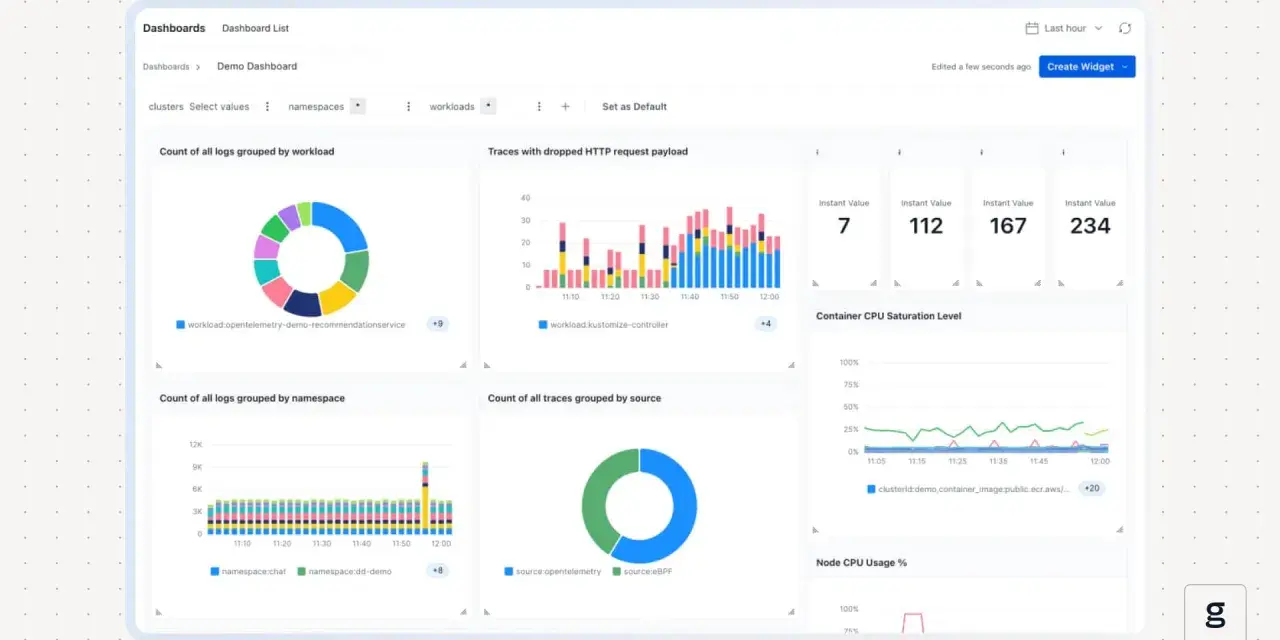
Where packet data sits beside logs, metrics, and traces
OpenTelemetry gives me a clean way to think about the rest of the stack: traces, metrics, and logs each describe a different aspect of runtime behaviour. Packet data is the transport-layer lens that sits underneath them. It does not replace those signals; it explains the parts they cannot see.
| Signal | What it shows | Best for | Main limitation |
|---|---|---|---|
| Packets | Exact network behaviour, timing, retransmission, handshakes, protocol framing | Root-cause work, transport issues, security forensics | Heavy, sensitive, and harder to keep at scale |
| Flows | Who talked to whom, how much, and for how long | Topology, capacity, anomaly detection | No payload detail |
| Traces | The path a request took through services | Microservice latency and dependency mapping | Blind to network issues outside the instrumented app |
| Metrics | Rates, errors, latency, saturation, and trends | Alerting and long-term health | Too coarse to explain a single failure on its own |
| Logs | Events and application narratives | Audit trails and detailed app context | Only as good as what the code decides to log |
That table is how I decide what to collect first. If I need broad, low-cost visibility across a platform, I start with traces, metrics, and logs. If I need to prove a transport problem or investigate suspicious behaviour, packet inspection becomes the sharper tool. On Linux, eBPF-based observability is especially useful because it can inspect application executables and the OS networking layer without changing application code, which gives me a middle ground between pure telemetry and full packet capture.
Once the data sources are mapped, the next question is process: how do I investigate without drowning in traffic?
How I approach an investigation from symptom to packet
I do not start by capturing everything. I start with one sentence that defines the problem as narrowly as possible. For example: “The checkout API is timing out for UK users between 09:00 and 10:00 UTC.” That phrasing tells me where to look, when to look, and which path matters.
- Set a falsifiable question. I want the capture to prove or disprove something specific, not just generate a large file.
- Choose the narrowest useful capture point. Client side, server side, load balancer, gateway, or service mesh each sees a different slice of the problem.
- Use a capture filter when I can. Wireshark capture filters are applied before capture starts, while display filters are for exploring what I already have.
- Keep the window short. I usually begin with a minute or two around the incident, then repeat at the same time if the failure is bursty.
- Correlate before I interpret. I line up timestamps with traces, logs, and metrics so I do not confuse network delay with application delay.
- Check both directions. A request can look healthy on the client path and broken on the return path, especially in asymmetric networks.
The reason I work this way is simple: packet captures are expensive in time, storage, and attention. A small, well-aimed capture usually beats a large, unfiltered one. When teams skip that discipline, they often end up with a file that proves nothing except that the network is busy.
That practical discipline also influences the tooling I choose, because not every tool is built for the same job.
Tools I reach for and when each one wins
I think about packet analysis tools in terms of friction. Some are excellent for interactive diagnosis. Others are better for automation or always-on visibility. The wrong choice makes the work harder than it needs to be.
| Tool | What it is best at | Where it falls short | My use case |
|---|---|---|---|
| Wireshark | Deep interactive inspection of packet contents and protocol state | Not ideal for continuous high-volume monitoring | Interactive incident analysis, protocol debugging, teaching others what happened |
| TShark | Command-line capture and decoding | Less friendly for exploratory analysis than the GUI | Automation, repeatable investigations, lightweight exports |
| eBPF-based observability | Low-friction visibility into Linux networking and service behaviour | Platform and kernel constraints, plus less payload detail | Early warning, service-level correlation, and network metrics without code changes |
| Flow telemetry | Scale, pattern detection, and topological understanding | No packet payload and limited protocol detail | Always-on monitoring and traffic baselining |
I reach for Wireshark when I need human eyes on a protocol exchange. I use TShark when I want the same visibility in a script or pipeline. I use eBPF-style telemetry when I need lower-friction, continuous visibility on Linux and I am more interested in request timing and network behaviour than in every byte of the payload. And I use flow data when the question is scale, not forensics.
That mix is usually enough for day-to-day observability. The hard part is knowing where the approach stops being reliable.
Where packet analysis fails or distorts the picture
Packet data can be decisive, but it can also mislead if I trust it too much. The biggest risk is thinking the capture is the ground truth when it is only one view of the truth.
- Capture-point bias. A capture taken at the client may not match what the server saw, especially on asymmetric paths.
- Mirror-port loss. If the mirror or tap drops frames under load, the missing packets can look like application loss.
- Encryption. TLS and QUIC reduce payload visibility, so I have to lean more on metadata, timing, and endpoint telemetry.
- Clock drift. Bad timestamps make correlation with logs and traces unreliable.
- Overscoped captures. Collecting everything turns analysis into a storage problem and increases privacy risk.
- Offload effects. Hardware or kernel offload can change how packets appear in the capture, which can confuse a quick reading.
My rule is to treat conclusions as provisional until the capture path itself has been trusted. If I cannot explain where the packets were observed, I do not trust the story they are telling. That is especially important when the issue affects security, because a false negative is just as damaging as a false alarm.
And once security enters the picture, the governance question becomes unavoidable, particularly for UK organisations.
The controls I would put in place before making packet monitoring routine
In the UK, I would assume packet captures can contain personal data until proven otherwise. They may expose IP addresses, cookies, session identifiers, usernames, or other content that is not appropriate to collect casually. That means I would put the same discipline around packet data that I would put around any other sensitive operational record.
The ICO’s monitoring-at-work guidance pushes organisations toward necessity, proportionality, and transparency, and its network-security guidance explicitly expects monitoring of incoming and outgoing traffic for threats. I read that as a clear operational standard: monitor when there is a real need, keep the scope tight, and document why the data is being collected.
- Define the purpose first. I would write down the exact problem the capture is meant to solve before anyone starts collecting traffic.
- Minimise by default. I would filter aggressively, shorten retention, and avoid collecting payloads unless they are genuinely needed.
- Restrict access. Only the people who need to inspect the data should be able to open it.
- Encrypt and classify captures. A pcap should be treated like any other high-value diagnostic artifact.
- Use a DPIA when monitoring expands. If the monitoring is broad, continuous, or likely to affect workers, I would expect a formal data protection impact assessment.
- Tell people what is being monitored. Covert monitoring should remain the exception, not the default.
That governance layer is not bureaucracy for its own sake. It is what keeps packet monitoring useful instead of risky. The teams that do this well end up with better incident response, cleaner security evidence, and fewer surprises when someone asks what was actually collected.
If I had to reduce the whole topic to one practical idea, it would be this: packet data is most valuable when it is selective, correlated, and governed. Use it to explain the parts of the system that traces and logs cannot reach, but keep it narrow enough that the answer is still easy to trust.