What matters most before you commit to a monitoring platform
- Start with the three core signals: metrics, logs, and traces.
- Use observability to explain incidents, not just to detect them.
- Look for useful correlation, sane alerting, and OpenTelemetry support.
- For UK teams, data location, access control, and auditability are not optional extras.
- Costs usually rise with ingest volume, retention, and the number of teams sharing the platform.
What cloud monitoring services actually do
At the simplest level, a managed monitoring platform collects operational data from cloud workloads, turns that data into alerts and dashboards, and gives teams a place to investigate what changed. In practice, that means watching compute, containers, databases, network paths, application performance, and sometimes user experience too. The useful versions do more than present charts: they normalise data from different services, correlate related events, and reduce the time it takes to move from “something is off” to “here is the cause”.
I usually think of the service as an operational control layer. It should tell you whether a system is healthy, whether it is degrading, and whether a change in one part of the stack is affecting another. If it only produces noise, it is not a monitoring strategy, just a billing line. Once that distinction is clear, the next step is understanding how monitoring and observability fit together.Why observability changes the game
Monitoring and observability are related, but they solve different problems. Monitoring is best at answering known questions: is latency above threshold, are error rates rising, is a node down, did a job fail. Observability is better at answering unknowns: why did this release behave differently, which dependency is causing the slowdown, and what changed before the incident started.
The difference matters because cloud failures are often indirect. A service may still be “up” while response times creep past the point users tolerate. A database might be technically reachable but slow enough to trigger retries upstream. A deployment can pass basic checks and still break a specific path for one customer segment. Observability gives you the context to connect those dots instead of guessing from isolated alerts.
The cleanest way to think about it is this: monitoring finds the symptom, observability explains the system. That is why mature teams rarely buy dashboards alone; they buy correlation, investigation depth, and enough telemetry to ask better questions. With that in mind, the next section is about the features that actually earn their place in a production stack.
The capabilities that matter most
Not every platform needs every feature, but some capabilities are hard to justify skipping. If a service cannot handle the basics well, the rest is decoration.
Metrics, logs, and traces
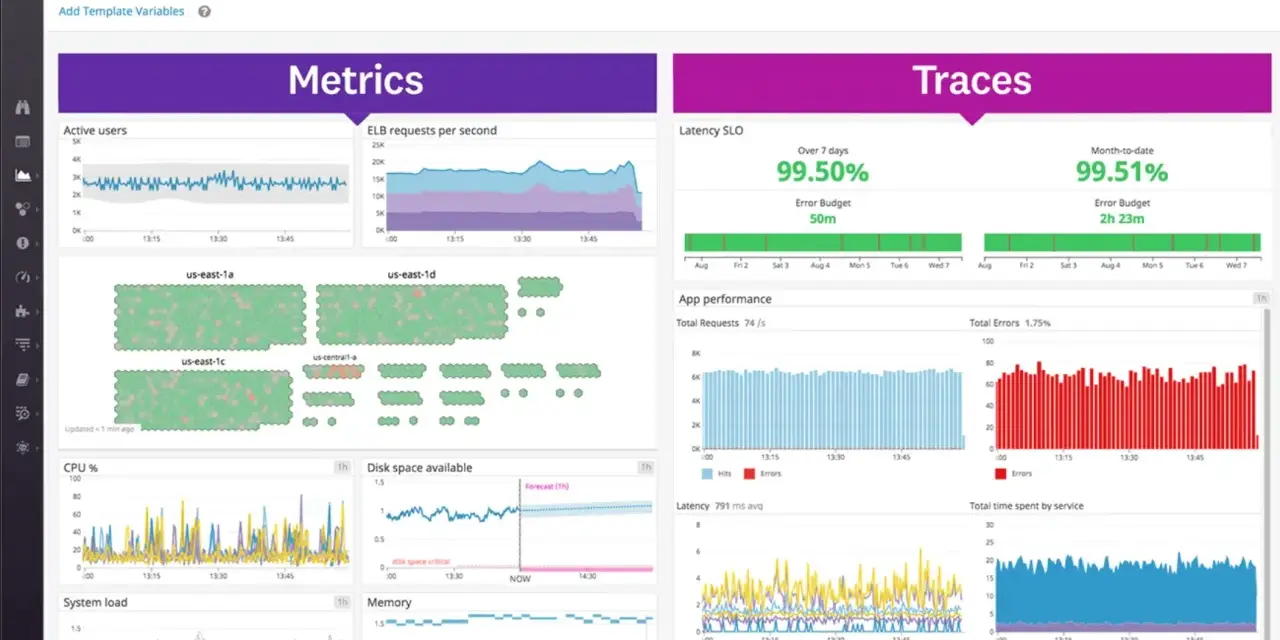
These are the three core signals. Metrics are numerical measurements over time, such as CPU, latency, queue depth, or error rate. Logs are event records with detail. Traces show the path of a request through services. Together they let you see both the trend and the story behind it. If one of those layers is missing, investigations become slower and more speculative.
Synthetic checks and real user monitoring
Synthetic monitoring uses scripted checks to simulate user journeys, such as logging in, searching, or completing a checkout. Real user monitoring, usually called RUM, captures what actual browsers or mobile apps experience. Synthetic checks tell you whether a path should work; RUM tells you whether it really works for people. I treat them as complementary, not interchangeable.
Alerting that respects service ownership
The best alerting is tied to service impact, not raw sensor noise. That usually means SLOs, or service level objectives, which are targets for reliability or performance. A good alert should tell the on-call engineer what broke, who owns it, and how urgent it is. If every metric page turns red at once, the platform is teaching your team to ignore it.
Correlation and context
This is where strong products separate themselves. The platform should connect an alert to the deployment that preceded it, the service dependency behind it, the region affected, and any related logs or traces. That context is what turns a dashboard into a diagnostic tool.
Read Also: AWS NetFlow - Master VPC Flow Logs & Network Monitoring
OpenTelemetry support
OpenTelemetry is an open standard for generating and exporting telemetry data. It matters because it reduces lock-in and makes it easier to instrument hybrid and multi-cloud systems consistently. In 2026, I would treat strong OpenTelemetry support as a default requirement rather than a nice-to-have.
Once you know which capabilities matter, the real buying decision becomes a model question: native tooling, full-stack SaaS, a managed partner, or a self-hosted stack. The right answer depends on how much control, scale, and operational burden you want to carry.
Which service model fits which team
There are four common ways to consume cloud monitoring capability, and each one trades convenience against control.
| Model | Best for | Strengths | Trade-offs |
|---|---|---|---|
| Native cloud monitoring | Teams deep in one cloud provider | Fast setup, strong integration, familiar billing model | Can become fragmented in multi-cloud or hybrid estates |
| Full-stack observability SaaS | Teams that want broad visibility across apps and infrastructure | Unified telemetry, better correlation, faster investigations | Cost can rise quickly with data volume and retention |
| Managed monitoring partner | Smaller teams or organisations without deep ops capacity | Less internal overhead, more guidance, stronger implementation support | You may trade some flexibility for service dependency |
| Self-hosted stack | Teams with strict control requirements or specialised workflows | Maximum control over data and architecture | Higher operational burden and more maintenance work |
In my view, most teams start by underestimating how much operational labour a self-managed stack creates. That does not make it wrong, but it does mean the choice should be deliberate. If your priority is speed, correlation, and fewer moving parts, a service model is usually the more practical option. If your priority is strict control over data and workflow, you may accept the overhead. That trade-off becomes even more important when the stack has to satisfy UK-specific constraints.
How to choose one for a UK cloud stack
For UK teams, the question is rarely “can it monitor the cloud?” Almost any serious platform can do that. The real question is whether it fits your regulatory, operational, and commercial constraints without creating a future migration problem.
Here is the checklist I would use first:
- Data location and access - confirm where telemetry is stored, who can access it, and whether the vendor supports the residency expectations you need.
- Hybrid and multi-cloud support - if workloads span public cloud, private cloud, SaaS, and edge sites, the platform should normalize data across all of them.
- Security and audit trails - role-based access, audit logging, and least-privilege controls matter just as much as dashboard quality.
- Integration depth - check support for Kubernetes, CI/CD, identity providers, ticketing, chat ops, and incident response tools.
- Support model - if your team operates outside standard hours, make sure the vendor’s support and escalation process is realistic for that.
For regulated sectors in the UK, I also look at whether the product makes it easy to prove what was seen, when it was seen, and who responded. That matters in finance, healthcare, public sector work, and any environment where auditability is not an afterthought. The smoother the evidence trail, the less painful incident reviews become. Once those basics are covered, the next issue is money, and that is where many buyers get surprised.
Where budgets go wrong
Monitoring platforms are often sold as predictable subscriptions, but the bill usually follows usage patterns more than the sticker price. The main cost drivers are ingest volume, retention, high-cardinality labels, the number of teams using the platform, and how much data you keep searchable versus archived. Cardinality just means the number of unique values in a metric label, and it can explode cost faster than people expect.
There are also softer costs. More data is not automatically better if no one uses it. A platform with every possible signal can still fail if engineers do not trust the alerts or cannot find the relevant context in time. I have seen teams pay for broad coverage and end up using only a fraction of it because the setup was too noisy to operate.
A practical budget usually separates hot data from cold data. Logs and traces may only need fast, searchable retention for a limited window, while older data can move to cheaper storage. Many teams also keep their most important dashboards and SLO alerts narrow, then expand only where incidents or business value justify it. That discipline keeps the platform useful instead of merely expensive. The next section turns that into a rollout plan you can actually execute.
A rollout that actually sticks
The fastest way to fail with a monitoring platform is to try to instrument everything at once. I would start with three to five critical services, the ones that would hurt most if they failed for an hour. Then I would define a small set of business-relevant signals, not just infrastructure metrics: request latency, error rate, saturation, failed deployments, and the user journeys that matter most.
- Instrument the core services first.
- Set one or two SLOs per service.
- Wire alerts to a real owner, not a generic inbox.
- Correlate logs, metrics, and traces for the same service boundary.
- Review alert quality after every incident and remove noise aggressively.
That sequence keeps the project manageable. It also creates quick wins, which matters because monitoring work is easy to postpone when it feels abstract. Teams usually get value fastest when they focus on one business-critical path, prove that the signal is useful, then expand with discipline. Once that foundation is in place, the shape of a good platform becomes easy to spot.
What a mature setup feels like in practice
A mature cloud monitoring setup is not loud. It does not drown the team in charts or page everyone for every fluctuation. It surfaces meaningful change, explains it in context, and helps engineers answer three questions quickly: what broke, why did it break, and who should act on it. That is the standard I use when I evaluate any monitoring service.
If a platform helps you shorten incidents, reduce false alarms, and make deployments less stressful, it is doing real work. If it only provides a prettier dashboard, it is probably underdelivering for the price. For most organisations, especially those running mixed cloud estates in the UK, the sweet spot is a service that combines strong telemetry collection, practical observability, and enough operational discipline to keep the data useful. The best stack is the one your team can trust during an incident, not the one that looks busiest on a sales call.