A passive test access point is one of the cleanest ways to watch network traffic without becoming part of the path. I use it when I need packet truth rather than another dashboard opinion, especially for latency hunts, incident response, and security investigations where any added interference would pollute the result. The real value is not just visibility, but visibility that does not change the thing being observed.
What matters most before you choose one
- It copies traffic for monitoring and leaves the forwarding path alone.
- It is strongest when packet-level evidence matters more than sampled statistics.
- Passive capture complements logs, metrics, and traces rather than replacing them.
- SPAN is easier to switch on, but a TAP usually gives a cleaner feed.
- Placement, monitor capacity, and tool-chain design matter as much as the hardware itself.
What a passive TAP actually does on the wire
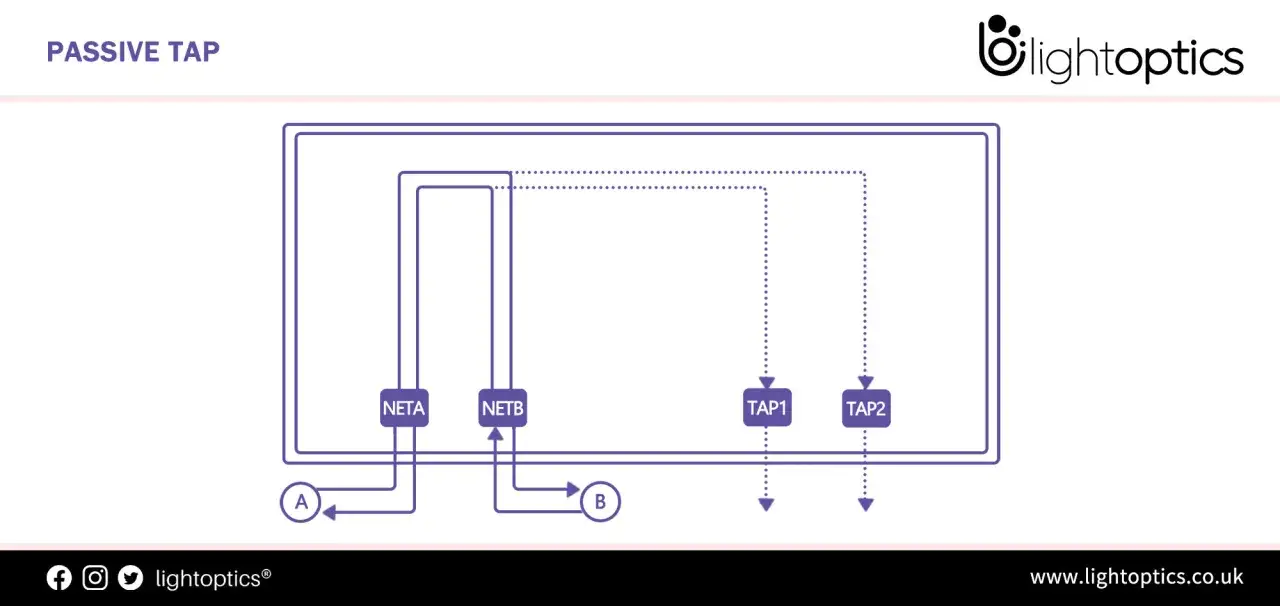
The term TAP stands for test access point, and in network practice it means a device inserted between two points so it can duplicate the traffic passing through. The important part is what it does not do: it does not sit inline as a gatekeeper, it does not shape packets, and it does not retransmit traffic back into the network.
That makes it different from a proxy or firewall. A good passive design gives the monitoring tool a copy of what actually traversed the link, while the original conversation between the two endpoints keeps moving as normal. Some models are truly unpowered; others need power for aggregation or regeneration, but the passive behaviour stays listen-only either way. I think of it as a read-only microscope, not a middlebox. Once that separation is clear, the observability angle becomes obvious.
How it improves observability without getting in the way
For observability, packet capture sits at the bottom of the evidence chain. Metrics tell me that something is slow, logs tell me what the application believed, traces tell me where a request spent its time, and packet data tells me what was really on the wire. That last layer is where a lot of hard problems stop being mysterious.- Latency and retransmissions show up at the packet level even when application logs are vague.
- Asymmetric routing becomes visible when one direction looks normal and the other does not.
- MTU, fragmentation, and handshake problems are easier to prove when you can inspect the exchange directly.
- Security investigations gain context because you can see patterns, not just alerts.
- Change validation becomes simpler after a firewall rule, WAN change, or application release.
Keysight’s guidance on synthetic monitoring draws a useful line here: active tests generate traffic to probe performance, while passive capture watches the real thing. I like having both, but I do not confuse them. A passive feed gives evidence; an active probe gives expectation. The best monitoring stacks use each where it is strongest, and that distinction matters most when you compare it with SPAN and other active methods.
Passive TAP, SPAN and active monitoring are not the same thing
If I am choosing between a passive TAP, a switch mirror session, and synthetic tests, I start by asking what failure I am trying to catch. The answer usually decides the tool.
| Approach | What it gives | Where it wins | Main trade-off |
|---|---|---|---|
| Passive TAP | A faithful copy of traffic on the link | Forensics, deep troubleshooting, security analysis, long-running monitoring | Requires physical placement and proper downstream capacity |
| SPAN or mirror port | A copied view from the switch | Quick checks, ad hoc debugging, lower-cost visibility | Can be best-effort under load and depends on switch resources |
| Active synthetic monitoring | Test traffic that you generate on purpose | Pre-production checks, SLA validation, latency benchmarking | Measures simulated behaviour, not real user traffic |
SPAN is often fine for a temporary look, but I treat it as best-effort visibility. A TAP is the better choice when fidelity matters, and active monitoring is the better choice when I want to measure user journeys before production traffic arrives. In real environments, I usually want at least two of the three. Once the tool choice is settled, placement decides whether the feed is useful or just technically correct.
Where I would place one in a real network
I do not start with every access port. I start with choke points: core uplinks, firewall boundaries, WAN edges, critical east-west paths between application tiers, and any segment where a brief blind spot would slow down an incident review. In UK environments, that usually means data centre interconnects, campus cores, internet breakouts, branch aggregation points, and regulated segments where being able to reconstruct events later matters as much as real-time alerting.
There are a few practical rules I follow:
- Tap links that carry shared pain, not just a single user’s traffic.
- Match the media and speed so the monitor path does not become the bottleneck, whether the link is 1, 10, 25, 40, or 100 GbE.
- Use aggregation wisely if several tools need the same feed, because fan-out without planning can create loss downstream.
- Keep the capture point close to the problem, otherwise you waste time proving symptoms on the wrong segment.
- Choose the smallest number of links that answer the question, because more visibility points often create more operational overhead than insight.
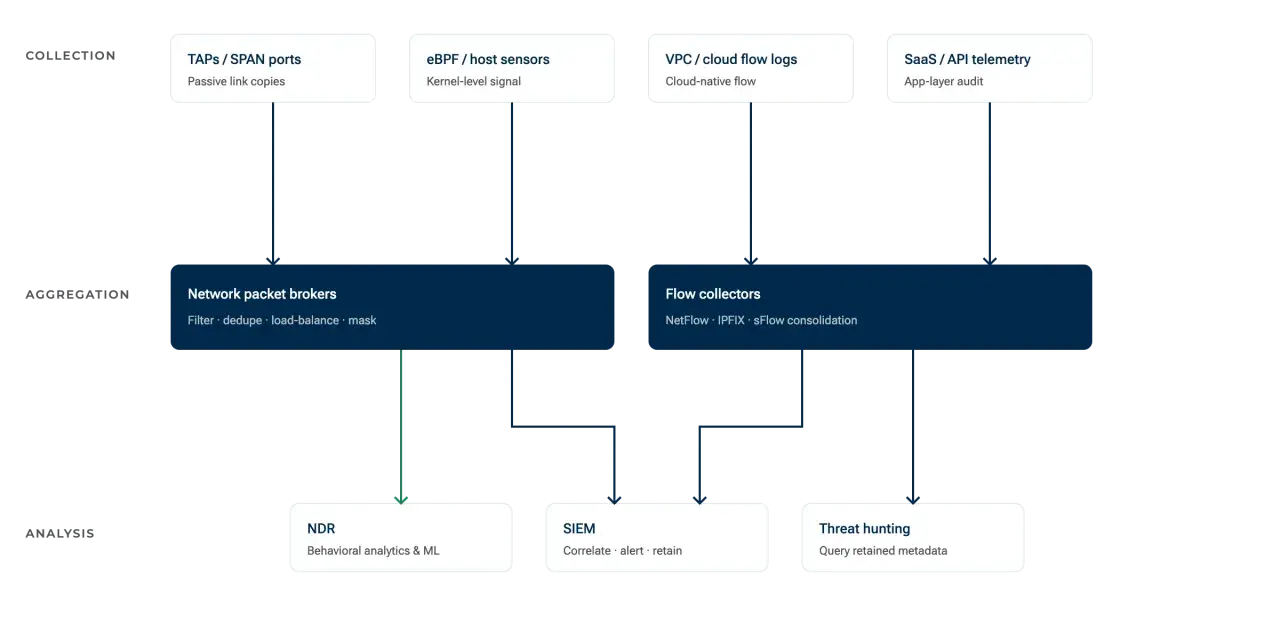
When multiple tools need the same traffic, I usually prefer a packet broker or an aggregation layer rather than stretching a single monitor feed too far. That way, the tap stays focused on copying traffic and the visibility stack handles filtering, deduplication, and distribution. After placement comes discipline, and that is where most deployments stumble.
Common mistakes that reduce visibility
The device itself is rarely the problem. The failure usually comes from how the feed is used.
- Treating the TAP as the whole observability stack means you miss the context that logs, metrics, and traces provide.
- Capturing the wrong link gives you perfect data about an irrelevant path.
- Oversubscribing the monitor feed pushes packet loss into the collector or tool chain instead of the network.
- Assuming every passive feed can also block or shape traffic leads to bad design expectations.
- Ignoring time synchronisation makes multi-source troubleshooting harder than it should be.
- Forgetting privacy and access control creates risk, because packet data can contain usernames, tokens, or personal information.
- Buying for port count before checking ingest capacity creates an expensive source of unread data.
The one mistake I see most often is believing that passive visibility automatically equals complete visibility. It does not. The TAP gives you a trustworthy sample of the wire, but only if the rest of the chain can keep up and the chosen link is actually the right one. Once those basics are right, the deployment becomes a checklist instead of a guessing game.
What I would check before putting one into production
Before I approve a deployment, I want the answers to be boring and precise. If any of these are fuzzy, the project is not ready.
- What link am I watching, and is it the one that will actually explain the problem?
- What is the media type and speed, and does the device support it cleanly?
- Do I need fail-open behaviour or a passive design that keeps traffic flowing if power is lost?
- How many tools will consume the feed, and is the downstream pipeline sized for that load?
- Do I need filtering, slicing, or deduplication before the data reaches storage or analysis?
- How long will I retain packet data, and who is allowed to see it?
- Do I also need synthetic tests so I can compare real traffic with controlled probes?
That last question matters more than people expect. Passive capture is excellent for proving what happened, but it is not a substitute for testing service behaviour under controlled conditions. If the job is to observe without interfering, a passive TAP remains one of the most dependable options. It will not replace metrics, traces, or active tests, but it gives you something those tools cannot: a faithful view of the packets themselves.