The quickest route to useful flow telemetry
- NetFlow records conversations between endpoints, so it is best for visibility, baselining, and anomaly detection rather than payload inspection.
- A working setup needs four parts: a flow record, an exporter, a monitor, and the interfaces that generate data.
- The fields that matter most are source and destination IP, source and destination port, protocol, byte count, packet count, and start and end time.
- For most monitoring stacks, active timeout around 60 seconds, inactive timeout around 15 seconds, and template refresh around 30 seconds are sensible starting points.
- Use NetFlow to find hotspots, unusual talkers, and traffic shifts, then confirm root cause with packet capture or logs when needed.
What NetFlow actually tells you
At its core, NetFlow turns packet conversations into flow records. A flow is usually defined by a set of key fields such as source and destination IP, source and destination port, protocol, and the ingress interface, then enriched with counters like bytes and packets plus timing information. The IETF's IPFIX standard uses the same template-based idea for extensibility, which is why flow export has stayed relevant even as networks have become more encrypted and more distributed.
That distinction matters because NetFlow is a metadata tool, not a packet payload tool. I can tell which host is talking, how much it is sending, how long the conversation lasts, and often which path or interface it used, but I cannot inspect the actual packet contents. For observability and monitoring, that is usually enough to spot hotspots, baselines, and changes in behaviour. For deep forensic work, I still need packet capture or logs.
Once that is clear, the practical question becomes how to build a clean export path without creating more noise than insight.
Setting up the exporter, collector, and monitor
The cleanest deployments start small. I normally choose the interfaces where visibility matters most, then export only from there instead of enabling every port by reflex. On a UK WAN edge, that usually means internet breakout, data-centre uplinks, VPN termination, and any link where bandwidth contention hurts users first.
- Create the flow record. Pick the fields you need to answer one real question, not every field the device can expose.
- Define the exporter. Set the collector address, transport port, and export protocol. UDP is common, but the important part is consistency between device and collector.
- Build the monitor. Bind the record and exporter together so the device knows what to collect and where to send it.
- Attach the monitor to ingress and, when needed, egress on the chosen interfaces or VLANs.
- Verify that the collector receives both templates and data, not just empty records.
Two timer settings deserve attention. 60 seconds for active timeout, 15 seconds for inactive timeout, and 30 seconds for template refresh are sensible baseline values for most operational setups. I treat those as starting values, not sacred numbers: shorten active timeouts if you want finer-grained visibility, but expect more export traffic; lengthen them if the collector is overloaded or the device is very busy.
One practical habit I keep is using a stable exporter identity where the platform allows it. It makes filtering, alerting, and troubleshooting much easier when the collector sees a consistent source. Once the pipeline is stable, the next step is deciding which fields will actually help you interpret what the network is doing.
Choosing the right fields and timers
Most bad NetFlow deployments fail because they export too little context or too much of the wrong context. I keep a short list of fields that almost always pay for themselves, then add extras only when I have a clear use case.
| Field group | Why I care | When to add it |
|---|---|---|
| Source and destination IP | Shows who is talking to whom | Always |
| Source and destination port | Separates web, DNS, VPN, database, and other services | Always |
| Layer 3 protocol | Tells TCP from UDP and other traffic types | Always |
| Bytes and packets | Shows volume and conversation shape | Always |
| Start and end time | Makes duration and burst analysis possible | Always |
| Ingress and egress interface | Helps map traffic to links, zones, and paths | Most production deployments |
| DSCP or TOS | Shows whether traffic is marked for priority | QoS troubleshooting |
| TCP flags or application labels | Adds detail for security or app analysis | When the platform supports it and you will use it |
If a collector is strict about templates, those basics are non-negotiable. Some downstream tools will simply ignore incomplete templates, which is frustrating if you assumed the export was working. The best record is the one your tools can actually read.
I also pay attention to export cadence. If active timeouts are too long, short spikes disappear into a one-minute or five-minute block. If they are too short, the collector gets flooded with more records and the device spends more time exporting than observing. For most operational dashboards, one-minute active export is a good compromise, with shorter windows reserved for incident response or high-churn environments.
With the right fields in place, the data starts to tell a story instead of just occupying storage.
Reading flow data without fooling yourself
When I analyse NetFlow, I look for change before I look for volume. A single large flow may be normal backup traffic, while a smaller flow that appears at an odd hour on an unusual port can matter much more. That is why flow telemetry works so well for observability: it gives me a time-bound view of behaviour, not just a static list of connections.
Start with a baseline
I usually compare the last 15 minutes against the previous hour, and then the current day against a normal weekday pattern. The point is not to memorise every number; it is to see what changed after a release, a routing event, a firewall update, or a business cycle shift.
Read Also: North-South vs. East-West Traffic - Observability Guide
Then ask three operational questions
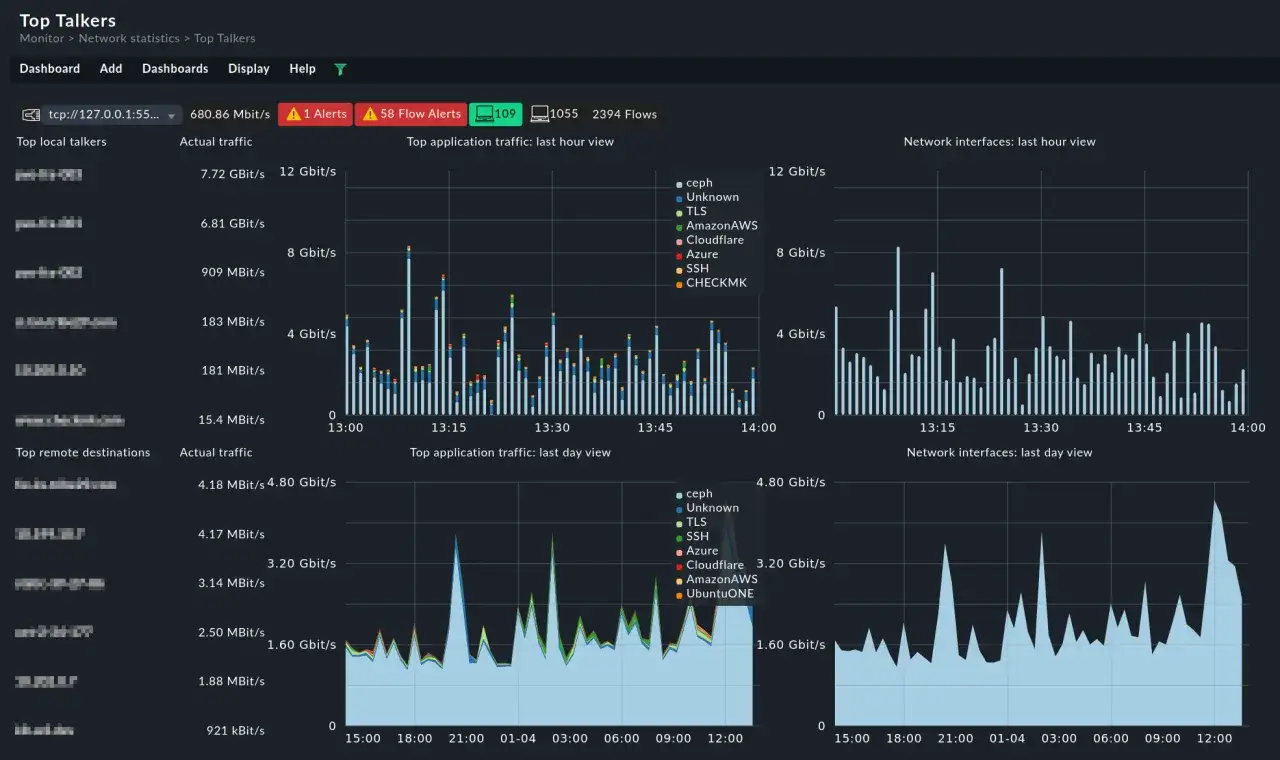
- Which hosts or subnets consume the most bandwidth over 15 minutes, 1 hour, and 24 hours?
- Which ports or applications suddenly dominate a link?
- Which conversations changed after a deployment, firewall rule, or routing update?
On UK enterprise networks, the most useful analyses are often unglamorous: who is saturating the leased line, why a SaaS app feels slow at 09:15, or whether a backup job is colliding with user traffic. I use NetFlow to narrow the scope quickly, then I move to logs, interface counters, or packet capture only when the flow view stops being specific enough. That discipline keeps investigations fast and avoids the trap of treating a broad traffic map as a full root-cause tool.
If the network is critical, I also watch for asymmetry and lateral movement. A surge of east-west traffic between internal subnets can be a sign of replication, but it can also be the first visible hint of a compromised host exploring the environment. The difference comes from context, so I always compare flows with change windows, authentication events, and known business activity. That is the point where flow data becomes genuinely observability-friendly: it sits between raw packets and high-level logs.Once you can read the patterns, it becomes easier to choose the right telemetry for the job.
Where NetFlow fits beside packet capture and sFlow
NetFlow is not the only way to observe traffic, and I think good teams do better when they know where its boundaries are. For most monitoring tasks, NetFlow is the sweet spot: lighter than full packet capture, richer than interface counters, and easier to trend than logs alone. But there are times when another method is the better tool.
| Method | What it gives you | Best use | Main limitation |
|---|---|---|---|
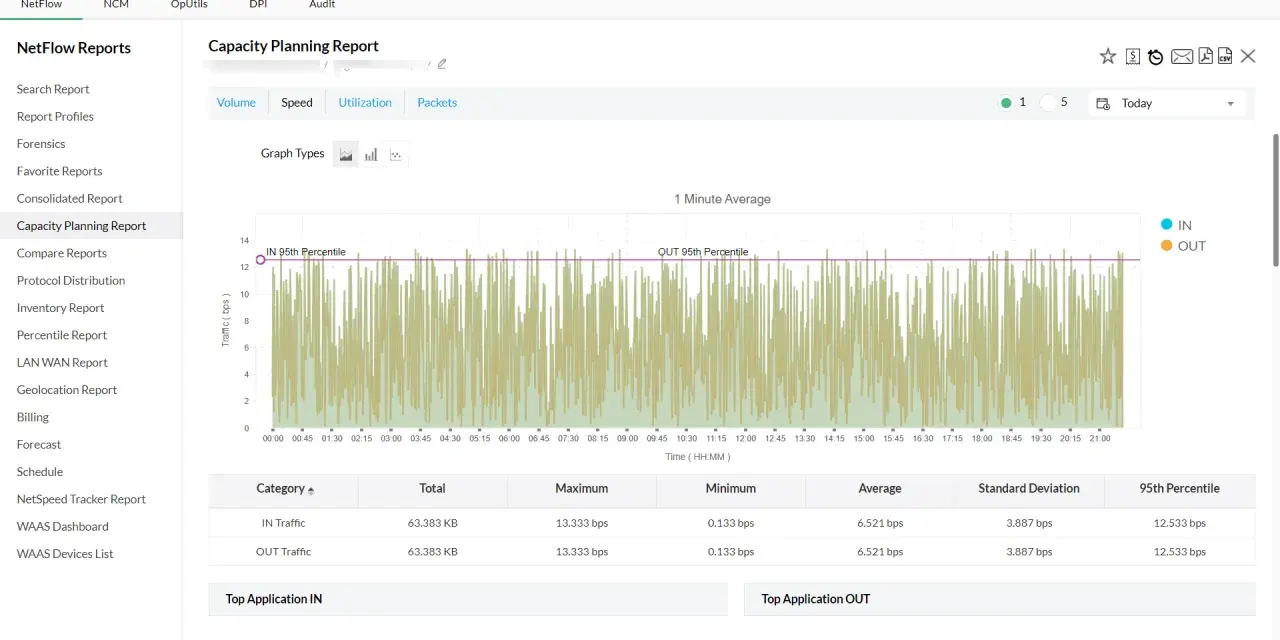
| NetFlow | Aggregated flow records with endpoints, ports, timing, and volume | Capacity planning, top talkers, behavioural baselining | No packet payload |
| IPFIX | Standardised flow export with a richer information model | Vendor-neutral flow analytics and extensible fields | Still flow metadata, not full packets |
| sFlow | Sampled packet data plus counters | Very high-volume environments where sampling is acceptable | Sampling can miss short events |
| Packet capture | Exact packets and payload | Deep troubleshooting, protocol decoding, forensics | Heavy, noisy, and storage-intensive |
The rule I use is simple. If I need trend visibility across days or weeks, NetFlow or IPFIX is usually enough. If I need content, retransmissions, malformed sessions, or protocol-level proof, I reach for packet capture. If I need broad scale with acceptable approximation, I consider sFlow or another sampled method. Flow telemetry answers the what changed question very well, but it does not replace every other visibility tool.
That makes the final checklist more important than the feature name itself.
My final checklist before I trust the dashboard
Before I rely on a NetFlow deployment, I check five things:
- The collector is receiving templates and flow records from every exporter I expect.
- Interface counters and flow volumes roughly agree, so I know I am not missing traffic or double-counting it.
- Time synchronisation is solid across exporters, collectors, and log sources.
- Retention matches the job: a few days for incident response, longer for trend analysis, and only as much as the storage budget can support.
- Alerts are tied to specific questions, such as unexpected WAN saturation, unusual ports, or sudden changes in top talkers, rather than generic noise.
If I were rolling this out today, I would start with a small but valuable slice of the network: internet edges, WAN links, and key data-centre uplinks. That gives fast operational value without turning the collector into another noisy platform to babysit. From there, the best expansion strategy is boring and effective: verify one segment, tune the fields and timers, then add the next only after the first one is paying back the effort.