The short version for busy teams
- Telemetry is the raw signal: metrics, logs, traces, events, and other machine-generated data.
- Monitoring is what turns that signal into dashboards, alerts, thresholds, and on-call action.
- Observability helps you answer why a system is behaving the way it is, especially when the failure is unfamiliar.
- Good telemetry makes monitoring more accurate; good monitoring makes telemetry worth collecting.
- The strongest setup is not either/or. You need enough telemetry to diagnose problems and enough monitoring to catch them early.
How telemetry, monitoring and observability differ in practice
I find it easiest to separate these three ideas by asking a different question of each one. Telemetry asks, what did the system emit? Monitoring asks, is it healthy right now? Observability asks, why is it doing that? Once you keep those jobs separate, the stack becomes easier to design and much harder to overcomplicate.
| Concept | What it is | Main question | Typical outputs | Common limitation |
|---|---|---|---|---|
| Telemetry | Data emitted by applications, infrastructure, or devices | What happened? | Metrics, logs, traces, events | Creates volume and noise without context |
| Monitoring | The operational practice of watching system health | Should someone act now? | Dashboards, alerts, SLO checks, anomaly detection | Can miss novel or cross-service failures |
| Observability | The ability to infer internal state from external signals | Why did this happen? | Correlated logs, traces, service maps, investigative views | Depends on good instrumentation and useful context |
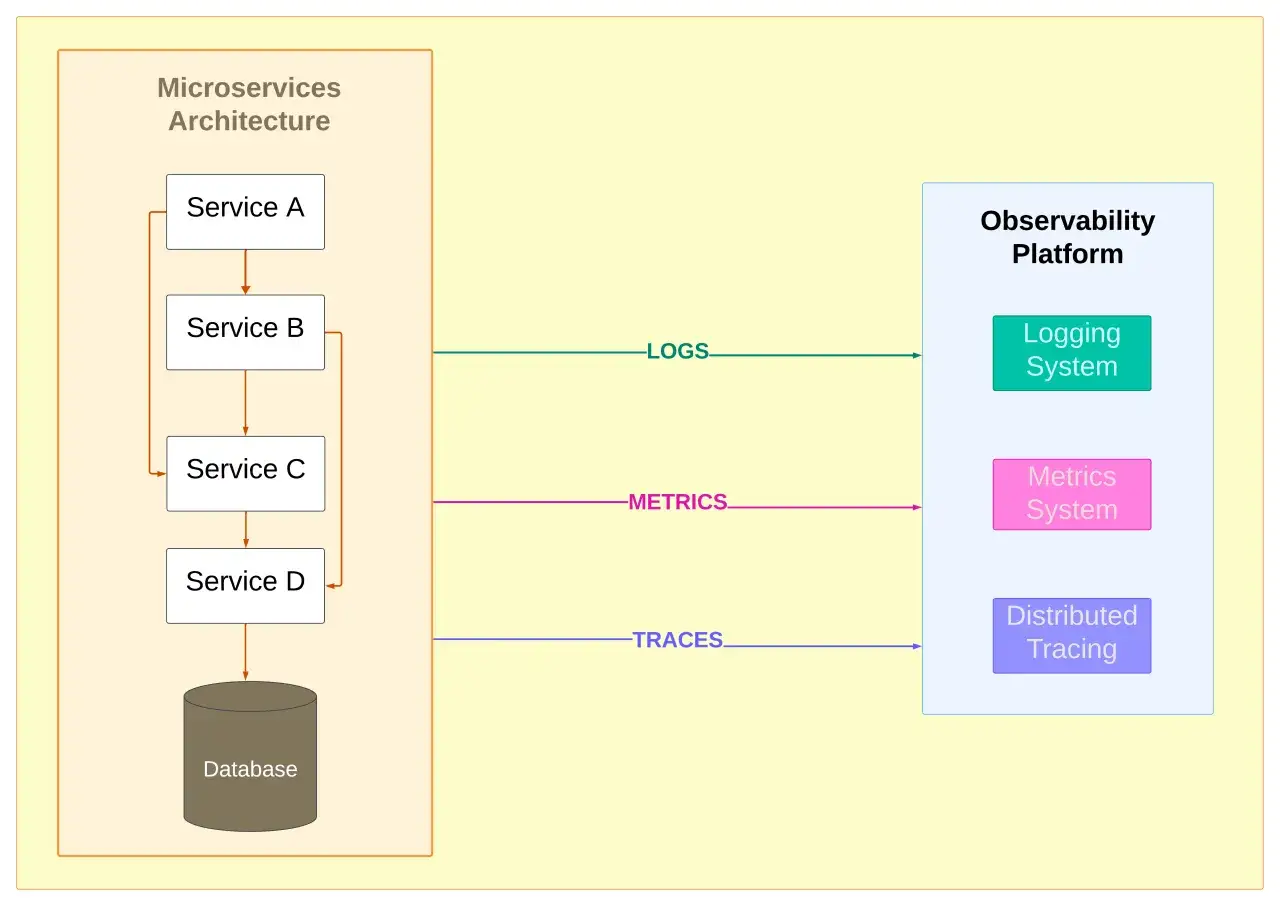
That split sounds theoretical until something breaks across three services at once. Then the difference becomes obvious: telemetry gives you the evidence, monitoring tells you whether the issue is urgent, and observability helps you trace the failure back to the cause. From there, the next question is what exactly counts as telemetry in a modern stack.
What telemetry actually captures in a modern stack
Telemetry is not one thing. It is the collection layer that turns system behaviour into signals you can store, query, and compare over time. In practice, that usually means a mix of metrics, logs, traces, and domain-specific events. If the data is generated by the system and helps you understand its state, it belongs here.
Metrics
Metrics are the compact, numerical signals that make trends visible. They are ideal for latency, error rate, CPU, memory pressure, queue depth, request volume, and saturation. If I want to know whether a checkout service is drifting from 180 ms to 520 ms p95, I start with metrics because they show change quickly and cheaply.
Logs
Logs are the detailed narrative. They help when you need context about a specific event, such as an authentication failure, a bad deployment, or a misconfigured integration. Structured logs are far more useful than free text because they can be filtered, grouped, and joined with other signals. I usually treat logs as the place where the system explains itself line by line.
Traces
Traces follow a request as it moves through services, queues, caches, and external dependencies. They are the fastest way to see where time is being spent in a distributed system. A trace can show that 80 ms of a 220 ms request was lost waiting on an upstream payment API, which is a very different problem from a slow database or a saturated edge node.
Read Also: Network Flow Data - The Unsung Hero of Observability?
Events and domain signals
Events capture meaningful changes in state, not just technical noise. A feature flag flipped, a firmware update started, a certificate expired, a device dropped offline, or a user completed a checkout are all events that matter depending on the business. For connected-device fleets, a heartbeat event is often more useful than yet another CPU graph because it answers the real operational question: is the device alive and reporting?
Once you know which signal belongs to which question, monitoring becomes much easier to design. That leads directly to the part most teams get wrong: turning data collection into useful operational awareness.
What monitoring is supposed to answer first
Monitoring is not primarily about diagnosis. It is about early warning. A good monitoring system answers three questions quickly: is the service healthy, is the problem getting worse, and who needs to know? If those questions are not clear, the alerting layer becomes a source of noise instead of protection.
The best monitoring setups are usually built around user impact, not internal vanity metrics. I want alerts for things like:
- p95 latency above 400 ms for 10 minutes on a customer-facing endpoint.
- Error rate above 1% for 5 minutes on a critical transaction path.
- Queue depth rising continuously for 15 minutes, which often signals work is accumulating faster than it is being processed.
- Availability dropping below a defined service level objective, with a burn-rate alert showing the error budget is being consumed too quickly.
The exact thresholds depend on the service, but the principle does not: alerts should be actionable, owned, and tied to a runbook. A dashboard that looks impressive but never changes anyone’s behaviour is just expensive wallpaper. Once monitoring is focused on response, the real diagnostic work happens in how the data is connected.
How telemetry becomes useful once you correlate it
Raw telemetry on its own is only halfway to insight. The useful layer appears when you correlate signals across a request path, a deployment version, a customer segment, a region, or a device class. That correlation is what turns isolated records into a story you can actually follow.
I like to think of the collection pipeline as a filtering and enrichment stage. Data comes in from apps, hosts, and devices, then gets normalised, tagged, sampled, and routed to the right backend. In that process, a few fields matter far more than beginners expect:
- Request IDs, so one user action can be followed across services.
- Service names and deployment versions, so incidents can be tied to a release.
- Environment and region, so a problem in London does not get confused with one in Dublin or Frankfurt.
- Customer or tenant identifiers, used carefully, so an issue can be isolated without exposing unnecessary personal data.
- Trace spans, which show where time is actually being spent.
This is where OpenTelemetry matters in practice. It gives teams a common way to instrument and export traces, metrics, and logs without locking the data to a single backend. The point is not to collect more for the sake of it. The point is to make the data portable enough that your analysis stays useful even when the tooling changes.
There is also a cost side to correlation. High-cardinality labels can be valuable, but they can also make a metric expensive to store and slow to query. A label with 10 values is easy to live with. A label with 10,000 values can turn a simple signal into a storage headache. Once you see that trade-off clearly, the next issue is usually not technology but habit.
Where teams confuse the two and pay for it
The most common mistake is treating a dashboard as observability. It is not. A dashboard can show that something is wrong, but it rarely tells you why, and it often hides the assumptions behind the numbers. I have seen teams with beautiful charts still spend hours guessing because the signals were never linked together.
Other mistakes show up when the collection side is strong but the operational side is weak:
- Collecting everything, then retaining too little of the right data to investigate a real incident.
- Alerting on every spike instead of on sustained user impact, which creates fatigue and distrust.
- Using logs as a dumping ground for secrets, personal data, or unstructured noise that nobody can safely search.
- Tracking infrastructure health while ignoring customer journeys, which makes the system look fine even when users are blocked.
- Keeping telemetry in silos, so metrics, logs, and traces cannot be joined into one timeline.
For UK organisations, I would be especially strict about restraint and access control. If a field does not help you investigate, comply, or operate the service, it probably should not be collected in the first place. That discipline becomes even more important when your systems span cloud, edge, and partner integrations. So if the question is what to do first, I would start by narrowing the focus.
The rule I use when resources are limited
When time, budget, and people are limited, I do not start by instrumenting everything. I start with the most important customer journeys and the few signals that can tell me whether those journeys are healthy. That usually means latency, errors, saturation, a handful of business events, and enough trace context to follow a request across service boundaries.- Define the critical paths first, such as sign-in, checkout, device registration, or API ingestion.
- Instrument the smallest useful set of metrics, logs, and traces for those paths.
- Build alerts from service levels and user impact, not from every internal metric that moves.
- Keep detailed telemetry long enough to investigate real incidents, then aggregate or age out data you no longer need.
- Review noisy alerts, high-cardinality fields, and retention settings on a regular cadence.
In practice, I often see teams keep detailed telemetry for 14 to 30 days and longer-term aggregates after that, but the right window depends on storage cost, incident patterns, and compliance needs. The main idea is simple: collect enough to explain failure, not so much that the data exhausts the team. When you draw that line well, telemetry supports monitoring instead of drowning it, and the system becomes easier to run, easier to trust, and much easier to improve.