The core idea at a glance
- DPI looks beyond packet headers and inspects payloads, protocol fields, and flow behaviour.
- Traffic is usually copied to a sensor through a TAP or SPAN/mirror port before inspection.
- The engine typically reassembles sessions, classifies protocols, matches rules, and then logs, alerts, blocks, or enriches telemetry.
- Encrypted traffic changes the picture; full inspection often requires decryption, while metadata-only analysis still provides useful signals.
- For monitoring teams, the biggest value is faster root-cause analysis, better baselining, and clearer application context.
- The biggest risks are performance overhead, false positives, and inspecting more data than your use case actually needs.
What deep packet inspection is really looking at
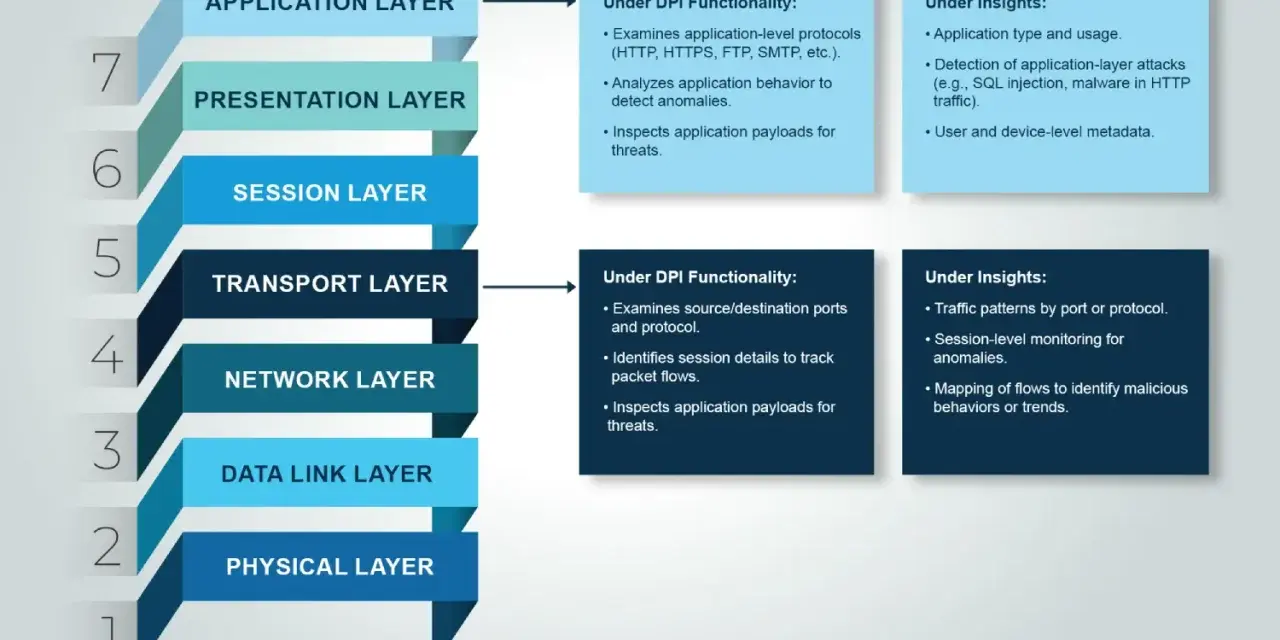
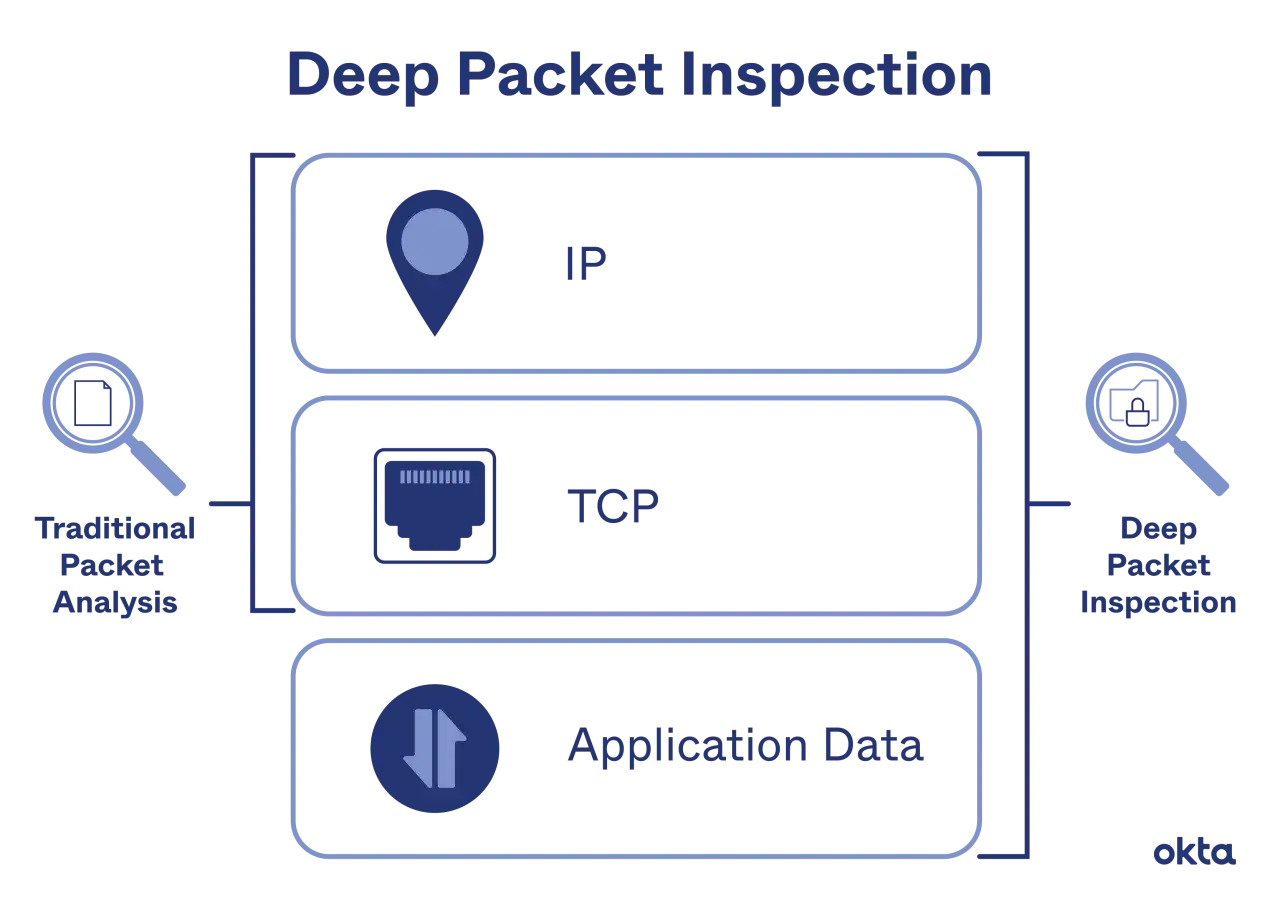
At a basic level, every packet has a header and, usually, a payload. The header tells devices where the packet came from, where it is going, and how it should be handled. DPI goes further: it examines application data, protocol markers, and sometimes the sequence of packets in a conversation so it can infer what the traffic is actually doing.
That distinction matters. A conventional stateful firewall can tell that a packet belongs to an established connection. A DPI system can often tell that the connection is carrying a file transfer, a video stream, a suspicious command-and-control pattern, or an API call that should not be happening at all.
I find it useful to think of the difference like this:
| Inspection type | What it looks at | Best for | Main blind spots |
|---|---|---|---|
| Shallow or stateful inspection | IP addresses, ports, connection state, basic flags | Fast filtering, simple access control, connection tracking | Application content, payload abuse, protocol misuse |
| Deep packet inspection | Headers, payloads, protocol behaviour, session context | Security analysis, performance troubleshooting, traffic classification | Encryption, scale, privacy concerns, processing cost |
That is the foundation. The next question is how the traffic gets to the analyser in the first place, because inspection is only as useful as the copy of the traffic you feed into it.
How traffic gets to the analyser
DPI can run inline, where the inspection device sits directly in the traffic path, or out of band, where it receives a copy of traffic for analysis. For observability and monitoring work, out-of-band is often the cleaner option because it avoids turning the inspector into a bottleneck for production traffic.
The two most common capture methods are network TAPs and SPAN or mirror ports. A TAP is a physical or virtual device that copies traffic as it passes through. A SPAN port is a switch feature that duplicates selected packets to a monitoring destination. TAPs are usually more faithful under load; SPAN is easier to deploy, but it can drop packets if the switch is busy or if too much traffic is mirrored at once.
In practice, the capture path has to do three jobs well:
- Preserve fidelity so the sensor sees the traffic you think it is seeing.
- Avoid loss because dropped packets can break session reassembly and distort alerts.
- Place the sensor wisely so you inspect meaningful traffic rather than an expensive firehose.
For a campus network, that might mean mirroring a core switch or a firewall interface. For cloud and hybrid estates, it may mean using virtual taps, packet brokers, or telemetry from gateways and sidecars. The design choice depends less on theory and more on where the useful conversations actually happen.
Once the traffic reaches the sensor, the real work begins: parsing, reconstructing, classifying, and deciding what matters. That pipeline is where the monitoring value is created.
The inspection pipeline from packet to alert
Most DPI engines follow a similar sequence, even if the vendor language differs. They do not simply read one packet and make a judgement. They build context.
- Capture the packet. The sensor receives copied traffic from an inline path, TAP, SPAN port, or virtual capture point.
- Normalise it. The engine strips away link-layer details it does not need and prepares the packet for analysis.
- Reassemble the session. TCP streams, UDP exchanges, and application exchanges are stitched back together so the analyser can see the full conversation, not just fragments.
- Classify the protocol. The system identifies whether the traffic looks like HTTP, DNS, TLS, SSH, SIP, a custom application protocol, or something evasive pretending to be something else.
- Match rules and signatures. The engine checks payloads, protocol fields, and behavioural patterns against policy, threat intelligence, or detection logic.
- Score and act. Depending on the deployment, it may log, alert, tag, block, rate-limit, quarantine, or enrich a monitoring record with context.
The important detail is that context accumulates. One packet may be boring. Twenty packets in sequence may show a failed login storm, a suspicious beacon, or a backend service retrying because an upstream dependency is slow.
That is why DPI has real observability value: it can turn raw network motion into evidence. The same mechanism becomes much harder to use once encryption enters the picture, which is where most modern networks now live.
What changes when traffic is encrypted
Encryption does not make inspection impossible, but it does change the boundary. With TLS, QUIC, and other encrypted protocols, a sensor often loses direct access to the payload unless it is positioned to decrypt traffic legitimately. In those cases, DPI may still see useful metadata such as IPs, ports, certificates, timing, packet sizes, server names, and flow patterns.
That creates three practical visibility levels:
| Visibility level | What you can usually see | What it is good for |
|---|---|---|
| No decryption | Endpoints, ports, timing, packet size, certificate data, some handshake metadata | Service identification, anomaly detection, capacity trends, rough troubleshooting |
| Selective decryption | Everything above plus headers and payloads for chosen traffic | Security investigation, policy enforcement, detailed diagnostics |
| Full decryption | Application content across the inspected path | Deep threat detection, rich forensic analysis, precise application tracing |
The catch is that full decryption is not free. It adds operational complexity, creates privacy implications, and can become a governance problem if the scope is too broad. In 2026, I would treat decryption as a targeted capability, not a default setting. That is especially true as encrypted protocols keep getting better at hiding more of the handshake itself.
For observability teams, the practical question is not whether encryption reduces visibility. It does. The real question is how much visibility you still need, and whether you can get it with metadata, selective inspection, or endpoint telemetry instead of decrypting everything.
Why observability teams still use DPI
For monitoring, the best use of DPI is rarely “inspect everything because we can.” It is more often “inspect the traffic that explains what logs and metrics cannot.” That difference matters, because packet-level data can reveal causes that higher-level dashboards flatten away.
Here are the cases where it tends to earn its keep:
- Root-cause analysis when an app is slow but CPU, memory, and basic network counters look normal.
- Protocol validation when you need to confirm that a service is speaking the right language to another service.
- Baseline detection when you want to know what “normal” looks like for a branch office, data centre segment, or cloud VPC.
- Security monitoring when you need to detect exfiltration patterns, suspicious C2 traffic, or policy violations.
- Performance troubleshooting when retransmissions, handshake delays, or application errors sit somewhere between the network and the app team.
A simple example: a web application starts returning intermittent 504s. Basic infrastructure metrics show no obvious saturation. DPI may reveal that the frontend is repeatedly retrying a backend API over TLS, the backend is timing out on one specific service call, and the actual bottleneck is a downstream dependency rather than the web tier itself. That is the kind of answer observability teams are paying for.
In other words, DPI is most valuable when the question is not “is the network up?” but “what exactly is happening inside the traffic?” Once you understand that use case, the limits become easier to judge.
Where the technique breaks down
DPI is powerful, but it is not a universal answer. The most common mistake is assuming that more inspection automatically means better visibility. In reality, the method becomes less attractive as traffic volume, encryption, and privacy sensitivity increase.
| Limitation | Why it matters | Practical response |
|---|---|---|
| Processing overhead | Deep inspection is compute-intensive and can add latency or packet loss if undersized | Use hardware acceleration, selective policies, or out-of-band analysis |
| Encryption | Payloads may be unreadable without decryption | Inspect metadata first, decrypt only approved traffic, lean on endpoint telemetry where needed |
| False positives | Pattern matching can misclassify legitimate traffic | Tune rules, baseline carefully, and validate alerts against real traffic |
| Privacy and governance | Payload inspection can capture personal or sensitive data | Minimise retention, restrict access, and document the inspection scope |
| Protocol churn | Modern applications change quickly and may hide behind standard ports | Prefer behaviour-aware detection over brittle port assumptions |
That is why implementation matters more than the headline technology. A good deployment pattern is selective, layered, and deliberate, not maximalist.
A deployment pattern that works in 2026
If I were designing a DPI-based monitoring stack now, I would keep the structure simple and controlled:
- Start with placement. Put capture points where they explain behaviour, such as internet egress, east-west service boundaries, core segments, or cloud ingress.
- Prefer passive collection first. Use TAPs, SPAN ports, or packet brokers for visibility before you consider inline enforcement.
- Inspect selectively. Apply deeper inspection to the traffic classes that matter most, rather than running full analysis on every packet.
- Separate metadata from payload. Keep broad telemetry for baselining and only pull payload where you need a concrete answer.
- Set retention rules up front. Raw packet captures are useful, but they should not live forever just because storage is available.
- Connect the output to operations. Feed detections and enriched context into SIEM, NDR, APM, and incident workflows so the data changes decisions.
The common thread here is restraint. DPI is at its best when it helps you answer a specific operational question quickly and with enough fidelity to act. It is at its worst when it becomes a default data vacuum.
The useful rule of thumb for real monitoring work
The practical answer is that deep packet inspection works by reconstructing traffic into a conversation, reading beyond the header, and matching what it finds against rules or behaviour models. That makes it a strong tool for observability, especially when logs are incomplete and metrics only tell part of the story.
My rule of thumb is straightforward: use packet inspection to explain, not to collect for its own sake. If metadata tells you enough, stop there. If you need more context, inspect deeper on the segment, protocol, or time window that actually matters. That approach keeps the signal high, the operational cost under control, and the monitoring stack useful instead of noisy.
When the network is the only place where the full story is visible, DPI can be the difference between guessing and knowing. The trick is to deploy it with enough discipline that the visibility is worth the overhead.